Key takeaways
- The chart of accounts (CoA) is an index of all financial accounts in a company's general ledger.
- There are 5 major account types in the CoA: assets, liabilities, equity, income, and expenses.
- The leading digit on each account is a reference number indicating what type of account it belongs to.
- It's a best practice to never delete accounts in your CoA until the end of the year.
What is a chart of accounts (CoA)?
A chart of accounts is an index of all the financial accounts in a company's general ledger (GL).
The general ledger is the greater record keeper for a company's financial accounts, with a trial balance validated debit and credit account records.
It segments financial transactions during a specific accounting period into specific account types.
The general ledger—and by extension, CoA—tells you where to record each transaction, making lookup and access easy.
CoA replaces the filing cabinets of yore, where back offices had intricate paper indexing systems for their transactions.
Now you have a birds-eye view of a company’s daily operations and how it’s spending and making money.
Why charts of accounts are important
The CoA is essential to good bookkeeping and financial management. A standard chart of accounts makes it easy for anybody to come into a business and quickly understand your finances.
It also makes it easy to track expenses and account balances so you can calculate financial ratios to quickly and easily report on the business's financial health.
Because it’s an index, it should make it easy to look up numbers and track money coming in and out of the company. It makes recording transactions simple.
A well-designed CoA will help you make better decisions, check your company's financial health, and make it simple to follow accounting and reporting standards.
How a chart of accounts (CoA) works
The CoA follows a principle known as double-entry accounting. Every time you log something in the chart of accounts, you make two entries: a debit from one account and a credit to another.
Here's what this means in practice:
Say you buy a new employee laptop for $800. You'd debit $800 from the appropriate Asset accounts (in this case, Cash) and credit $800 to the appropriate Asset accounts (in this case, Computers). This way the chart of accounts stays balanced, with the sum of the two entries being zero every time.
Five major account types in a chart of accounts are divided into balance sheet accounts and income statement accounts. While CoA can vary depending on the business, it will include assets, liabilities, equity, income/revenue, and expenses.
It's a best practice to list accounts in the order of appearance in financial statements, starting with the balance sheet.
Balance sheet accounts
Assets, liabilities, and equities make up the balance sheet. The balance sheet provides insight into the business’s current financial health and whether or not it owes money.
Asset accounts
The assets account lists a company's assets. These include liquid assets like cash, inventory, and equipment, plus prepaid expenses like paid-in-full leases or money that is under contract to come in.
These also include fixed assets like pieces of equipment that the company owns or office supplies like an expensive company printer.
A small corporation might include some arrangement of the following sub-accounts under their assets:
- Cash (main checking account)
- Cash (payroll)
- Cash (main savings account)
- Marketable securities
- Petty cash balance
- Accounts receivable
- Undeposited funds
- Inventory assets
- Prepaid insurance
- Prepaid expenses
- Vehicles
- Buildings
- Equipment
- Computers
Asset reference numbers usually begin with a 1.
Reference numbers are used within a chart of accounts as the leading digit on each account number denotes its type. This code makes it easier to find specific transactions in your chart of accounts.
The reference number for Assets is 1, Liabilities is 2, Equity is 3, Income/Revenue is 4, and Expenses are 5, 6, and 7. We’ll get into a more granular breakdown later.
Liabilities
Liabilities are any debt your company owes. These are the typical sub-accounts you'll see under liabilities:
- Accounts payable
- Company credit card(s)
- Wages payable
- Accrued liabilities
- Taxes payable (including sales tax)
- Notes payable
Liability reference numbers usually begin with 2.
You may have noticed that liability accounts usually have the word "payable" in their name. This is because liability accounts are where you record money that is under contract to leave the business but hasn't yet changed hands.
Because it's the company's obligation to make these payments, these accounts are "payable."
Shareholders equity
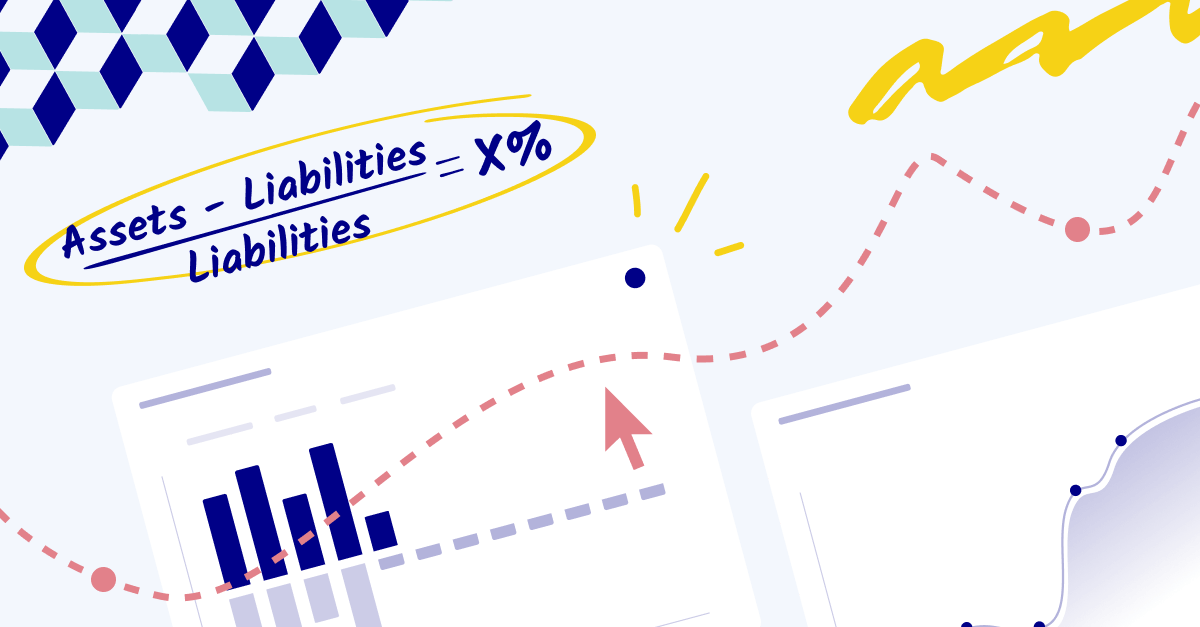
Equity is whatever is left after subtracting your company's liabilities from its assets. The simplest chart of accounts will only have three equity accounts listed here:
- Common stock
- Preferred stock
- Retained earnings
Even private companies will have shareholder equity accounts like this if they offer stock options to employees.
Equity accounts usually begin with reference number 3.
Income statement accounts
Expense and income/revenue accounts make up the income statement, which conveys the business’s overall profitability.
Income/Revenue
Revenue is the money your business brings in through sales or investments. Revenue accounts keep track of the money that comes in through normal business operations so you can calculate your net income and operating revenues.
- Investment income
- Sales
- Sales returns and allowances
- Fees earned
Income or revenue account numbers usually begin with reference number 4.
Expenses
Expenses are all the non-debt money you need to spend to keep your business running.
- Cost of goods sold (COGS)
- Advertising expenses
- Bank fees
- Depreciation expenses
- Payroll tax expenses
- Rent expenses
- Supplies expenses
- Travel expenses
- Utilities expenses
- Wages expenses
- Other expenses
Expense accounts typically begin with reference number 5.
It's common for organizations to structure their expense accounts by business function. This means that different company divisions have their own expense accounts.

Sample chart of accounts
This is a sample chart of accounts for a fictional SaaS company. You can see account descriptions, their account type, and the corresponding statement type.
|
Number
|
Account Description
|
Account Type
|
Statement
|
|
1010
|
Cash
|
Assets
|
Balance Sheet
|
|
1020
|
Savings
|
Assets
|
Balance Sheet
|
|
1030
|
Accounts Receivable
|
Assets
|
Balance Sheet
|
|
1080
|
Computers
|
Assets
|
Balance Sheet
|
|
2010
|
Accounts payable
|
Liabilities
|
Balance Sheet
|
|
2011
|
Credit cards
|
Liabilities
|
Balance Sheet
|
|
2014
|
Wages payable
|
Liabilities
|
Balance Sheet
|
|
2020
|
Accrued liabilities
|
Liabilities
|
Balance Sheet
|
|
2050
|
Taxes payable
|
Liabilities
|
Balance Sheet
|
|
2060
|
Notes Payable
|
Liabilities
|
Balance Sheet
|
|
3010
|
Preferred Stock
|
Equity
|
Balance Sheet
|
|
4010
|
Sales
|
Income
|
Income Statement
|
|
5000
|
Advertising Expenses
|
Expenses
|
Income Statement
|
|
5014
|
Wages Expenses
|
Expenses
|
Income Statement
|
|
5050
|
Payroll Tax Expenses
|
Expenses
|
Income Statement
|
Chart of accounts: best practices
Now let’s review the best practices for managing your chart of accounts.
Account descriptions
The chart of accounts should have a short, helpful description next to each account name and account type.
Names like "Accounts Receivable," "Credit Card (Operations)," and "Fees Earned" all have the appropriate level of detail.
These descriptions are important: you want to make it easy to find the appropriate accounts to create whatever financial statement you need for your reporting.
Don't delete accounts until the end of the year
It's a best practice to wait until the end of the year—after a close—to merge, rename, or delete accounts. Changing or removing accounts mid-year can add extra complexity during tax season.
That said, you can always add new accounts if needed.
Don't create too many accounts
Your chart of accounts is an index, but it's also meant to be a quick lookup table. You don't need to create a separate account for every transaction, utility, or sale.
Be smart about lumping similar items together. This keeps you from creating too many specific accounts and spares you from a painful cleanup process at the end of the year.
Be consistent with your CoA
It's best if your CoA doesn't dramatically change year over year.
Why?
You want to make it easy to compare the performance of different accounts over time. If you're splicing, merging, and deleting accounts, that information can get lost and you'll lose valuable financial data.
Or you'll spend too much time reconstructing old accounts, which can lead to mistakes and inaccurate data.
Plus, the GAAP (Generally Accepted Accounting Principles) set forth by the FASB (Financial Accounting Standards Board) states regularity and consistency as the first two rules.
Consolidate at the end of the year
Take the end of the year as an opportunity to consolidate and simplify your CoA.
Remember: brevity is elegance. You might be worried that a shorter chart of accounts obfuscates important details, but in our experience, that's unlikely to happen with a good naming system.
Understand reference numbers
We told you we’d come back here! Reference numbers are the first digit on each account number that denotes its type.
Most financial accounting software will automatically assign numbers for you, so you don't need to worry about creating them yourself. You just need to know the code.
Assets - 1
Liabilities - 2
Equity - 3
Income/Revenue - 4
Expenses - 5, 6, and 7
Here's a more granular breakdown of these different numbers in a standard chart of accounts:
1000 Assets
- 1200 Receivables
- 1300 Inventories
- 1400 Prepaid expenses & other current assets
- 1500 Property plant & equipment
- 1600 Accumulated depreciation & amortization
- 1700 Non-current receivables
- 1800 Intercompany receivables
- 1900 Other non-current assets
2000 Liabilities
- 2100 Payables
- 2200 Accrued compensation & related items
- 2300 Other accrued expenses
- 2500 Accrued taxes
- 2600 Deferred taxes
- 2700 Long-term debt
- 2800 Intercompany payables
- 2900 Other non-current liabilities
3000 Owner equities
4000 Revenue
5000 Cost of Goods Sold
6000-7000 Operating Expenses
Follow FASB and GAAP chart of account guidelines
FASB is The Financial Accounting Standards Board which determines the GAAP (Generally Accepted Accounting Principles).
The FASB is an independent nonprofit organization responsible for establishing accounting and financial reporting standards for companies and nonprofit organizations in the United States. It has the authority to establish and interpret GAAP for all of these entities.
Public companies in the U.S. must follow GAAP when their accountants compile their financial statements.
Use accounting software
There are several software solutions that can help automate and manage the chart of accounts.
While Excel and Google Sheets are great for beginning businesses, you’ll most likely want a dedicated financial software platform for all of your accounting needs.
Best chart of accounts software
Accounting solutions handle your CoA for you, which makes it super simple and easy to set up.
Here are some of our recommendations:
QuickBooks

QuickBooks from Intuit is more than an accounting solution: it's an ERP trusted by businesses of all sizes and across industries.
We like QuickBooks in particular because it integrates nicely with Cube, meaning you can keep your data stored in and managed by QuickBooks and import it to Excel or Google Sheets when you're ready to do your strategic finance work.
It's a win/win.
QuickBooks also has powerful reporting, which makes it easy to produce financial statements and other reports on your company's financial health.
Additional Features:
- Income & payment tracking
- Invoicing
- Cash flow planning
- Bill management
- eCommerce
- Payroll
- HR advisor
Pricing:
- Simple Start: $30/month
- Essentials: $55/month
- Plus: $85/month
- Advanced: $200/month
- Self-Employed: $15/month
Sage Intacct

Like QuickBooks, Sage Intacct is an ERP trusted by all kinds of businesses.
QuickBooks is more lightweight than Sage Intacct. We find that most enterprise companies prefer a bigger solution like Sage Intacct while companies who value leanness and agility flock to QuickBooks.
Sage Intacct also integrates with Cube, so all the aforementioned benefits still apply.
Additional Features:
- Project accounting
- Accounts payable
- Accounts receivable
- Order management
- Inventory management
- Cash management
- Cloud planning and budgeting
Pricing: Pricing is custom, but customers typically pay between $15,000 - $35,000 on an annual subscription, with sources reporting that pricing can reach $60,000 or more.
NetSuite

Like Sage Intacct, NetSuite is more than a simple accounting solution. It's an enterprise-level, cloud-based ERP.
We like NetSuite because it's a single platform for multiple services. Just like how marketers like HubSpot because it consolidates several independent tools in one place, FP&A professionals like NetSuite because it does accounting, works as a CRM, and allows for ecommerce transactions.
NetSuite's powerful reporting makes it easy to produce any kind of financial statement or to provide a snapshot of your financial performance.
NetSuite also integrates with Cube, so you can keep your accounting and FP&A separate. We call that a win.
Additional Features:
- Financial management
- Inventory management
- Acounts receivable
- Accounts payable
- Multi-currency
- Cash flow
- Payroll
- Project accounting
Pricing: Pricing is custom. However, customers and reviewers have reported that NetSuite costs include a $999/month licensing fee and an additional $99/month for each user.
Xero
.png?width=150&name=xero-logo%20(1).png)
Xero is an accounting solution for everyday businesses that allows users to work smarter with intuitive invoicing software. It enables you to send online invoices from the desktop or app as soon as the job is done.
The software tracks your finances with accounting reports and allows you to collaborate with your advisor online in real time. It can also track costs and profitability with its project and job tracker software.
Additional Features:
- Bill payment
- Expenses management
- Bank connections
- Project management
- Analytics
- Multi-currency
- Reporting tools
Pricing:
- Early: $12/month
- Growing: $34/month
- Established: $65/month
Google Sheets

Google Sheets offers a user-friendly interface widely used beyond the FP&A or finance worlds. It works on all computers and has some great features that Excel does not offer.
While most finance pros prefer Excel, Google Sheets makes numbers more accessible, easier to understand, and transparent.
Additional Features:
- Real-time editing
- Easy sharing
- Comments
- Smart fill
- Formula suggestions
- Integrations
Pricing:
- Personal: Free
- Business: $12/month
Excel

Excel is probably the most widely known and used spreadsheet software available. This classic go-to software for FP&A and strategic finance professionals is still widely used today.
Excel is not easily replaced by new software because it’s so familiar and effective. That’s why we designed Cube to be spreadsheet-native: it functions as a single source of truth for your source systems and lets you quickly push and pull data into Excel or Google Sheets.
Additional Features:
- Web and mobile versions
- Real-time collaboration
- Image recognition
- Power BI data sources
- Integrations
Pricing:
- Personal: $6.99/month
- Family: $9.99/month
- Business Basic: $6/user/month
- Business Standard: $12.50/user/month
- Business Premium: $22/user/month
- Business Apps Only: $8.25/user/month
FreshBooks
.png?width=150&name=freshbooks-logo-1%20(1).png)
FreshBooks is a cloud-based accounting software platform designed for business owners and accountants. It provides customized invoices for your products or services and automates other financial tasks.
This intuitive software makes it easy to keep your company's financial data organized and produce reports based on real-time information.
Additional Features:
- Accounting
- Payroll
- Invoicing
- Time tracking
- Estimates
- Project profitability
Pricing:
- Lite: $15/month
- Plus: $30/month
- Premium: $55/month
- Select: Custom pricing
SAP Business One

SAP Business One is an ERP solution offering an affordable way to manage a small business.
You can drive profitable growth by streamlining key processes, gaining greater insights into your business, and making decisions on real-time information.
Additional Features:
- Accounting
- Banking and reconciliation
- Financial reporting and analysis
- Customer management
- Mobile sales
- Warehouse and accounting integration
Pricing: Pricing is custom, but customers report paying between $99/per month - $132/month.
Conclusion
Now you know all about how to create a chart of accounts.
You also have a solid set of best practices for managing your chart of accounts.
So we're curious—
What did you learn about the best practices for your chart of accounts?
Share this post on LinkedIn and tag us to keep the conversation going.


.png)