AI & Agents
Cube AI makes financial data decision-ready across every FP&A tool and workflow.
Learn more about AI at Cube →Meet the Agents
The Agentic Layer
The governed foundation — platform capabilities.
Consolidation & Close
The entire financial close and data management cycle, at a high level.
See all →Industries
Purpose-built for how each sector runs finance.
Evaluate
For buyers in-cycle.
Learn & Support
Guides, resources, and help.
Company
About Cube, careers, and news.
AI accuracy study
Same numbers, same prompt, two different answers.
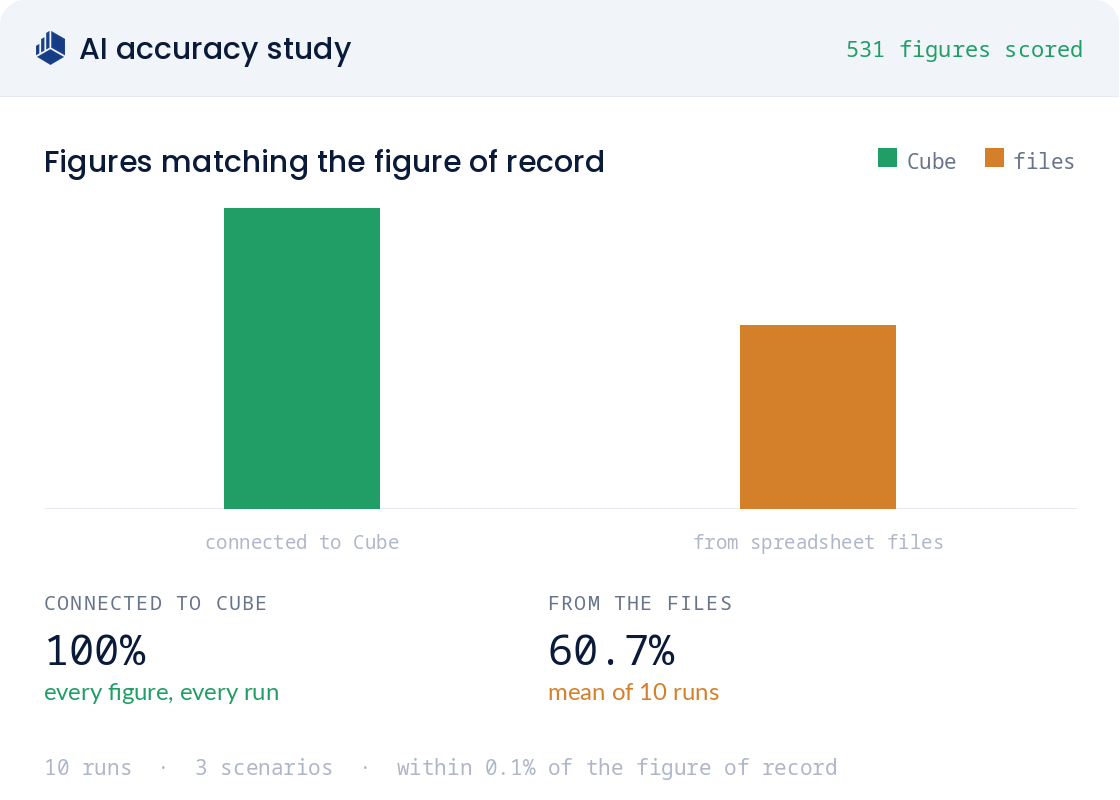
We asked an AI assistant for a month-end results dashboard twice: once connected to Cube, once reading the same numbers from the Excel models behind them. Connected, every one of 531 figures was correct. In the control condition, reading the files, 60.7%.
Cube is the agentic FP&A platform that connects bi-directionally to Excel and to source systems like NetSuite, giving finance teams trusted, decision-ready data without leaving their spreadsheets.
100%
Correct connected to Cube
60.7%
Correct reading the same files
531
Figures scored, 3 scenarios
The setup
The Situation
The finance function in this study is one FP&A lead and a controller. They close the books, reforecast, and answer the leadership team on Cube. Everyone else queries the numbers directly through Claude and Slack, with permissions applied, which means the answers have to be right without anyone checking them first.
That raised a question an opinion could not settle. If you hand a capable AI assistant a set of carefully built Excel models, does it actually need a governed layer underneath? The models are detailed. Every figure a person could want is somewhere in them.
So the test ran against a real set of books rather than a demo dataset: an actual month-end close, approved budget, and forecast of record. Those books are Cube's own, which we state plainly because it bounds what the study can claim. One prompt, asked twice, scored against the same figures of record both times. The design was fixed before any scoring happened, so the result could not be tuned toward a preferred answer.
Industry
FP&A software · 2-person finance team
Finance Team
1 FP&A lead, 1 controller
Scope Scored
531 figures · 3 scenarios
Method
Pre-registered, design fixed before scoring
Primary Use Case
Monthly reporting, variance, headcount, reforecasting
Stack Before Cube
Excel only · multi-hour monthly actuals update
The Problem
AI alone can't handle your
financial data.
Every figure the assistant needed was sitting in the spreadsheet models. It still missed about four figures in ten, because a file makes an AI guess which number you meant.
A file forces a judgment call
Which workbook, which tab, which row, and which of several look-alike figures you meant. Every one of those choices can go wrong, and enough of them landed on numbers that were wrong but plausible.
531 figures · 0.1% match bar
Nothing flags the misses
The output gives no signal about which figures drifted. Without the source system to check against, a wrong number reads exactly like a right one, and it passes review.
~40% of figures drifted · no warning
The forecast fares worst
Accuracy fell away exactly where finance applies judgment. Current-month actuals held up best, the budget was close behind, and the forecast collapsed. That is the view leadership plans against.
Actuals 78.7% · Budget 73.9% · Forecast 44.4%
THE AGENTIC FINANCE LAYER
Same data. Same prompt.
One source of truth.
The Solution
One definition per metric. One source.
Governed financial data is financial data unified from every source system into one layer where each metric has a single definition, a single source, and a path back to the source transaction.
The definitions are resolved before anyone asks a question.
Connected to Cube, the assistant has no look-alike to weigh. It retrieves the figure of record instead of settling on one. That is the whole difference the study measured: the prompt was identical and the underlying numbers were identical, so the only variable was where the figures came from.
Where the gap lives
The gap is widest where judgment is required.
Both routes were built from the same underlying data, yet accuracy split sharply by scenario. Reading the files, current-month actuals came back 78.7% correct and the budget 73.9%, while the forecast fell to 44.4%. Connected to Cube it was 100% on all three.
Total pipeline and pipeline coverage were never reproduced from the files at all. Operating margin, net income, total operating expenses and G&A were wrong most of the time. Revenue, the ARR waterfall, cash and headcount fared best.

Sensitivity
Loosening the bar does not close the gap.
Correct depends on how tight a match you require, so the control condition was scored at four tolerances. At 1% it reached 64.2%, at 5% it reached 70.8%, and at a forgiving 10% it still only reached 78.1%. The Cube-connected route returned 100% at every bar.
The control condition was run 10 independent times to measure consistency. Every run landed between 56.9% and 65.3%, a mean of 60.7% with a standard deviation of 3.1 points.

How We Tested
One prompt, answered twice, scored against the same figures of record.
The design was fixed before scoring, so the results could not be tuned to a target. Both routes answered one identical prompt. The only thing that changed was where the numbers came from.
1
2
3
The Results
Decision-ready data, everywhere the business asks.
100%
Of 531 figures reproduced correctly connected to Cube, on every run, at every tolerance bar tested
60.7%
Correct reading the same numbers from the Excel models. Mean of 10 runs, and no run scored above 65.3%.
80%
Of the monthly cycle time back for the FP&A lead since moving off an Excel-only process
0 hrs
A week spent answering "what is this number", down from three to five. The company queries the model directly.
"You're asking for a specific metric, and that metric is defined very clearly in Cube, and it will give you the exact answer. It doesn't have to think, really, it just has to find exactly what you're looking for."

Sr. Finance and Operations Manager
Study author
Common questions