Track

Variance Analysis

Monitor performance in real time, pinpoint the “why” behind every variance, and deliver clear, confident narratives that tell the story behind the numbers.

hero-template-image-mobile
Frame 1437258228

Know What Changed. Guide What’s Next.

document-magnifying-glass-1

Understand what changed and why

Cube makes it easy to surface variance drivers, compare time periods or scenarios, and drill into the details behind every number.

adjustments-horizontal-2

Eliminate version control issues

Actuals, budgets, and forecasts stay synced in real time. Say goodbye to broken links, stale numbers, and version sprawl.

presentation-chart-line

Reforecast with confidence

Use what you’ve learned from your analysis to update forecasts and adjust course quickly, all within the tools you already know and powered by AI.

Reporting Hero (1)

Key Capabilities

chat-bubble-oval-left-ellipsis

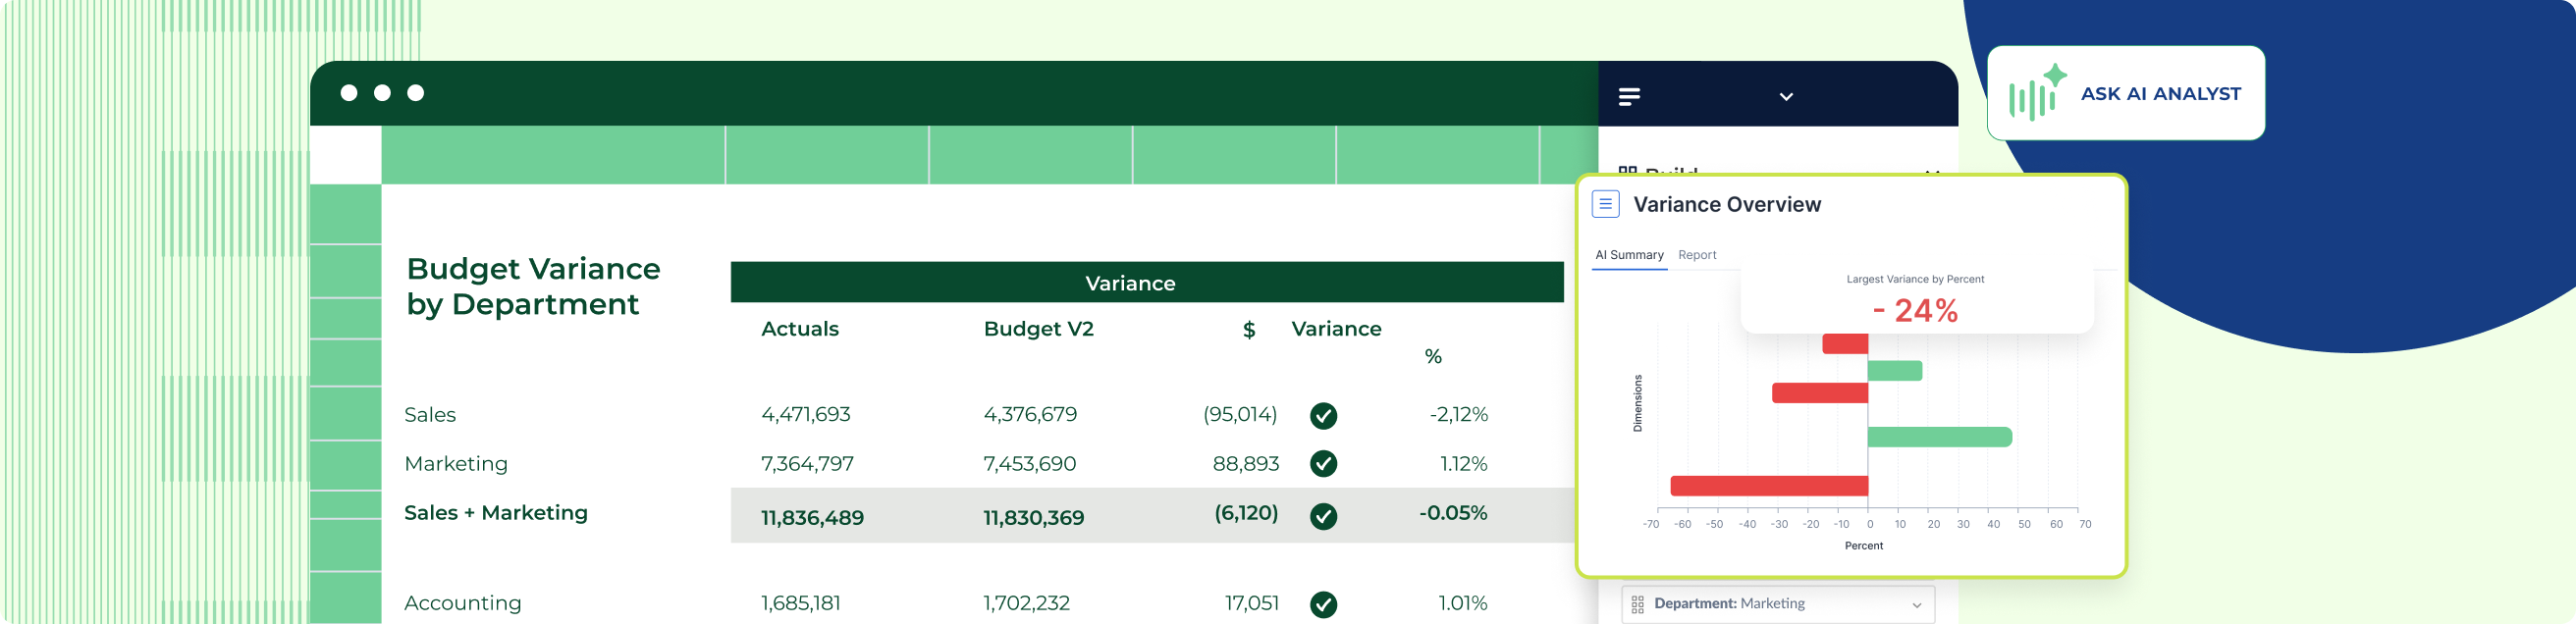
AI-powered Variance Analysis

Spot material variances automatically and generate narrative insights with Cube's AI for FP&A—right in your workspace, Slack, or Teams.

chevron-double-down

Drill into the details

Click into any number to explore the transactions behind it. Slice by account, department, or attribute without leaving your report.

clock

Always Synced, Always Current

Your forecasts, budgets, and actuals stay live and cloud-connected so reports always reflect the latest view of the business.

table-cells-2

Keep what works, add what doesn't

Reports perfected over time? Keep them by syncing your existing Excel or Google Sheets templates with Cube and update them in real time.

user-plus

Role-Based Collaboration

Tag department leads to explain variances directly in Cube while maintaining full control over structure, access, and data integrity.

bullseye

Ad-Hoc Reporting in Seconds

Drag, drop, and analyze on the fly. Compare budgets vs. actuals, drill into drivers, and build custom reports right from your spreadsheet.

Results from teams who got their data under control

tecovas

Now with Cube, we spend more than half our time on strategic work, partnering with the business instead of cleaning up the numbers.

James Mann


CFO

Smart-City-Logo-Navy

Cube will help organize your existing chaos and scale as you grow.

Dustin Walsted


VP of Finance, Technology, & HR

faqs

Still have questions?

What is Budget vs. Actuals analysis?

It’s how finance teams compare planned performance with actual results so they can explain variances and guide better decisions.

Do I have to use Cube’s templates?

Not at all. You can connect your existing spreadsheets and keep your formatting and logic. If you want a faster start, Cube offers out-of-the-box templates too.

Can Cube show what’s driving each variance?

Yes. You can drill into the details behind each figure. Cube's smart variance analysis offers AI-powered commentary to explain key variances automatically.

How often does Cube sync data?

You can sync on demand or set a schedule that fits your reporting cycle. Cube keeps all data aligned across your models and reports.

Can I reforecast based on my BVA analysis?

Yes. Cube links reporting and planning so you can easily adjust assumptions and forecasts when things change. You can also push your historical data, whether actuals or prior forecasts, into an AI model, and Cube will automatically build future projections for you.

Still have questions?