What's inside the budget vs actuals template
Because “what gets measured gets managed,” we know it’s critical to compare a company’s financial and operational results against some sort of measuring stick—in this case, the annual budget.
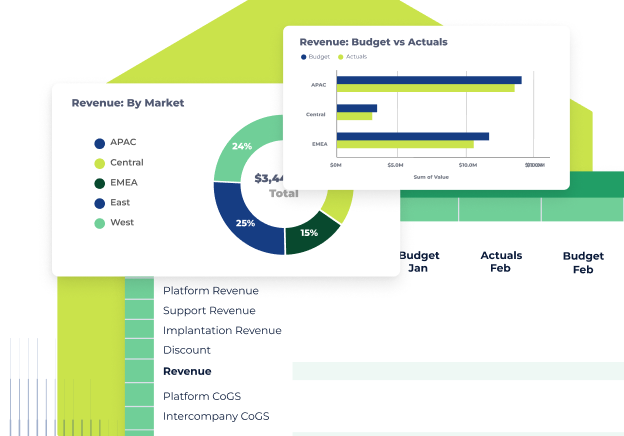
Creating and sharing a simple buget vs. actuals report helps drive transparency within the leadership team, fosters a culture of accountability, and helps the FP&A team analyze and communicate the economic drivers of the business.
The good news is, this tool is simple yet powerful.
This budget vs. actuals: profit & Loss template is ideal for busy FP&A professionals who want to shave some time off the month-end or period close process with a plug-and-play spreadsheet.
This P&L report helps answer questions like:
- Did we meet our gross profit target for the month?
- What are the key drivers of our net income variance for the period, quarter, year?
- Are we covering our costs?
It lets you monitor projected budgets, analyze profitability, and control spending. This should spark discussion around the leadership table about the "why" and the "so what."
Use this P&L template with Cube
This is a free Excel template. You don't need to be a Cube customer to use it!
But if you are a Cube user, you can start using this free profit and loss template in under two minutes. Here's how.
Step 1: Open the template in Excel or Sheets.
Step 2: Customize the row and column headers to match your Cube's dimensions and filters.
Step 3: Select the range where you want to fetch your data.
Step 4: Fetch your data.
.gif?width=600&name=CreateTemplate%20(1).gif)
Key takeaways on budget vs actual statements
- A profit and loss statement summarizes your revenue and expenses over a specific period.
- P&L statements review revenue, gross and net profit, and expenses to determine company profit or loss.
- They offer a clear view of financial performance, helping guide decisions and pinpointing areas needing attention.
Budget vs. actuals: What is a P&L Statement?
Accurately tracking your profit and loss is necessary to run a successful business. This information helps executives assess and manage a company's financial health.
But understanding profit and loss isn’t always easy—which is why we created a free P&L statement template for you.
The P&L (profit and loss statement) summarizes the revenues, costs, and expenses incurred during a specified time period. In other words, it shows precisely how much money you made and how much money you spent.
The budget represents your company's projected spending. Your company's projected budget should include expected revenue, expenses, cash flow, runway, and any other metrics you track with your financial model.
Your actuals are the real numbers you hit. How much revenue did you bring in? How much did you spend? And so on.
The profit and loss statement is one of three financial statements you'll need to issue at the end of each quarter and year. (The other two statements are the balance sheet and the cash flow statement.) It's also common to issue annual income statements.
How profit and loss statements work
P&L statements identify trends in revenue and expenses. They help businesses:
- Track growth over time.
- Assess their current financial situation.
- Demonstrate financial stability to potential investors.
- Understand how a company’s revenue streams are performing against each other.
- Make better financial decisions on spending and resource allocation.
Profit and loss formula
The formula to calculate profit and loss is:
Revenue - expenses = Profit/loss
Revenue is the total amount of money a company has earned from its products or services. Expenses are the costs incurred to generate those revenues. These include costs of goods sold (COGS), marketing expenses, employee salaries, rent, etc.
Profit/loss is the difference between revenue and expenses. If the number is positive, then it is "profit." If the number is negative, it’s a "loss."
For example, if a company has $1,000,000 in revenue and $700,000 in expenses, the profit would be $300,000. But if it had $1,300,000 in expenses, the loss would be at -$300,000.
Profit and loss statement formatting
Most profit and loss statements have a similar format that covers:
- Revenue: The total amount of money earned from the sale of goods or services.
- Cost of Goods Sold (COGS): The direct cost of producing goods or services sold.
- Gross Profit: The profit earned after subtracting the cost of goods sold from revenue.
- Operating Expenses: These are the costs of running the operations of your business.
- Net Profit: The profit earned after subtracting all expenses from revenue.
- Selling, General, and Administrative Expenses: These are the costs of running the business.
- Taxes: The total amount paid in taxes.
How to create a P&L statement in Excel and Google Sheets
Here's a step-by-step guide on how to create a P&L statement using our free template:
1. Download the free template
The first step is to building out your P&L statement to gain access to our free budget vs. actual template. Simply enter your work email on your right and click "get my free template." From there, follow the on-screen instructions to download it.
2. Edit line items
Next, edit the line items in the template to better suit your business if you need to. For example, if "interest income" isn't relevant, right-click the row and hit "delete." You can also add new line items, like "advertising expenses," to ensure you're capturing everything important.
When customizing your P&L structure, consider grouping similar expenses together (e.g., all marketing costs in one section) for better analysis. For SaaS companies, that might involve adding specific items like "subscription revenue" or “customer acquisition cost." And for retail businesses, perhaps “inventory shrinkage” or “seasonal promotions.”
Remember that your P&L template should reflect your company's unique revenue streams and cost centers - don't feel constrained by generic budget vs. actual templates. The goal is to create a financial snapshot that provides meaningful insights for your specific business model.
3. Enter revenue and expenses information
Select the duration for which you want to create a P&L statement, whether it's monthly, quarterly, or an annual budgeting process.
Otherwise, gather your financial records, including invoices, receipts, bank statements, and financial reporting software reports to ensure accuracy. Consider organizing your data in a separate worksheet first, then transferring the totals to your P&L template. Double-check your calculations and reconcile with bank statements to avoid discrepancies.
4. Track your results
Once you’ve entered your data, the template will calculate metrics like gross profit, operating expenses, and net profit automatically. Review these numbers regularly—ideally, monthly—and compare them against your targets to identify trends and patterns.
Look for key variances that exceed 5-10% of your budget and investigate their root causes. Set up financial reporting dashboards or charts to track progress over time, making it easier to spot seasonal fluctuations or emerging issues. Share these insights with department heads to encourage accountability and collaborative problem-solving. When you spot underperformance, develop action plans with specific, measurable steps to course-correct.
Conversely, when you exceed targets, analyze what worked well so you can replicate that success. This disciplined approach to tracking results transforms your P&L from a static document into a dynamic decision-making tool that keeps your company aligned with its strategic goals.
Types of profit and loss statements
There are two types of profit and loss statements: single-step and multi-step.
Single-step profit and loss statement
A single-step profit and loss statement lists all your income and expenses in one place. It's straightforward and gets right to the point, making it easy to see your bottom line at a glance. However, it doesn't dive deep into performance details, so you might not get insights into operational efficiencies or inefficiencies.
Multi-step profit and loss statement
This statement shows your company's income and expenses over a period. It's particularly useful for businesses with multiple income streams or significant operating costs, as it breaks down expenses based on their functions. This level of detail allows for a more thorough analysis of financial performance.
A multi-step P&L statement can help you see the bigger picture of your business's profitability. It includes:
- Operating costs: These encompass the income and expenses of your daily operations like rent, salaries, marketing expenses, and the cost of goods sold. Analyzing these costs helps you understand the operational efficiency of your business.
- Non-operating costs: These include secondary income and expenses, such as interest income and gains or losses. Understanding these costs provides insights into financial activities that aren't part of your core operations, helping you assess overall financial health.
What to avoid when crafting an effective budget vs. actual statement
When financial planning, steering clear of common pitfalls is as crucial as the budget itself. By understanding and proactively addressing the potential stumbling blocks, businesses can pave the way for a more accurate, transparent, and efficient budget vs. actual statement.
Here are important pitfalls to avoid as you build out your P&L statement:
- Overlooking detail: Failing to delve into granular details, remedied by ensuring comprehensive inclusion of all relevant income and expense components.
- Ignoring variability: Neglecting to account for potential fluctuations; the solution involves factoring in variable elements to enhance accuracy and reliability.
- Inconsistent tracking: Tracking inconsistently across periods, addressed by maintaining uniform tracking methods for meaningful comparisons.
- Rigidity in adjustments: Resisting timely adjustments, overcome by embracing flexibility and adjusting the budget as changes occur for agile financial management.
What's the difference between a P&L statement and a balance sheet?
Profit and loss statements summarize a company's income and expenses over a period of time.
Balance sheets show a company's assets, liabilities, and equity at a specific time.
Both statements assess the financial health of a business and track its progress.
Profit and loss statements for small businesses
Do you need a profit and loss statement as a small business owner?
If you're starting out and don't have a lot of revenue or expenses, you can get by with a simple income statement. But if you're looking for financing or trying to track growth, you'll want to use a profit and loss statement.
More resources
- The 10 top financial close software for a stressless month end
- 8 must-do steps for your month-end close process
- How to create & use pro forma statements
- What's a P&L budget?
Grab your free budget vs actual Excel template
Our free P&L budget vs. actuals template for Excel is designed to streamline your financial planning, providing a user-friendly solution for seamless investment tracking and analysis.
Enter your business email to the right and download the template to get started immediately.
Budget vs actuals FAQ
Do you need a profit and loss statement as a small business owner?
If you're just starting out and your revenue or expenses are minimal, a simple income statement might suffice. But as your business grows, especially if you're looking to secure financing or track expansion, a profit and loss statement becomes invaluable. It offers a comprehensive view of financial performance, helping you grasp where your money comes from and where it goes.
What's the difference between a P&L statement and a balance sheet?
Both P&L statements and balance sheets are vital for assessing the financial health of a business and tracking its progress. Profit and loss statements summarize a company's income and expenses over a period of time. Balance sheets show a company's assets, liabilities, and equity at a specific time.
While the P&L statement illustrates operational efficiency by showing profit margins and cost management, the balance sheet provides a snapshot of your financial position, highlighting liquidity and financial stability.
How can you monitor actual performance in a budget vs. actual statement?
To monitor actual performance in a budget vs. actual statement, start by comparing your budgeted figures against your actual financial results. Identify any variances or deviations from the budget—these can be positive or negative.
Analyze these variances to understand the underlying reasons, such as unexpected expenses, changes in sales volume, or shifts in market conditions. This analysis helps you make informed adjustments to your strategies and manage resources more effectively.
What are some examples of items to include in a profit and loss statement?
In a profit and loss statement, common line items include revenue, cost of goods sold (COGS), gross profit, operating expenses, and net profit:
- Revenue reflects the total income generated from sales.
- Cost of goods sold represents the direct costs associated with producing goods or services.
- Gross profit is the difference between revenue and COGS, indicating the efficiency of production.
- Operating expenses, such as salaries, rent, and utilities, show the costs of running the business.
- Net profit reveals the overall profitability after all expenses are deducted from revenue, providing insights into financial performance.


.png)


.png)
