The forecast changed at 6pm. Your board deck already knows.
Cube puts live financials in PowerPoint & Google Slides: insert a governed visual once, and when the forecast updates, the slides update. No copy-paste. No reformatting.
Definition
What is Cube Decks?
Cube Decks is a PowerPoint add-in that inserts live financial visuals: charts and tables connected directly to your Cube model. When actuals or the forecast change, one refresh updates every visual in the deck in place. For Google Slides, linked Cube charts update from the same model today, with a native add-on coming soon.
The last mile
The deck was final until the forecast moved.
Every chart is pasted, every table is resized by hand, and you walk into the board meeting hoping the deck still ties.
Screenshot archaeology
Every visual is a picture of a number that was true when someone pasted it.
The version problem
Forty slides assembled by hand means forty chances for last month's figure to survive review.
The 6pm rebuild
The forecast moves after close of play, and the evening goes to rebuilding slides instead of rehearsing the story.
Insert once
How live financials in PowerPoint & Google Slides work
In PowerPoint, insert a visual from your governed model onto the slide, filter it there, and refresh it there. In Google Slides, linked Cube charts update from the same model. The numbers on the slide are the numbers in the model, decision-ready everywhere work happens.
One governed model
Cube Decks inserts governed visuals into your slides, filtered and refreshed without leaving PowerPoint.
- Governed visualsEvery chart and table comes straight from the model
- Filtered on the slideScenario, period, entity, and department, in place
- Refreshed in placeOne click, and the slide matches the model


In PowerPoint
Every visual filters and refreshes in place.
The ribbon inserts the visual. The side panel carries its filters (scenario, period, entity, department) and the moment it was last refreshed, so anyone presenting knows exactly what they are looking at.
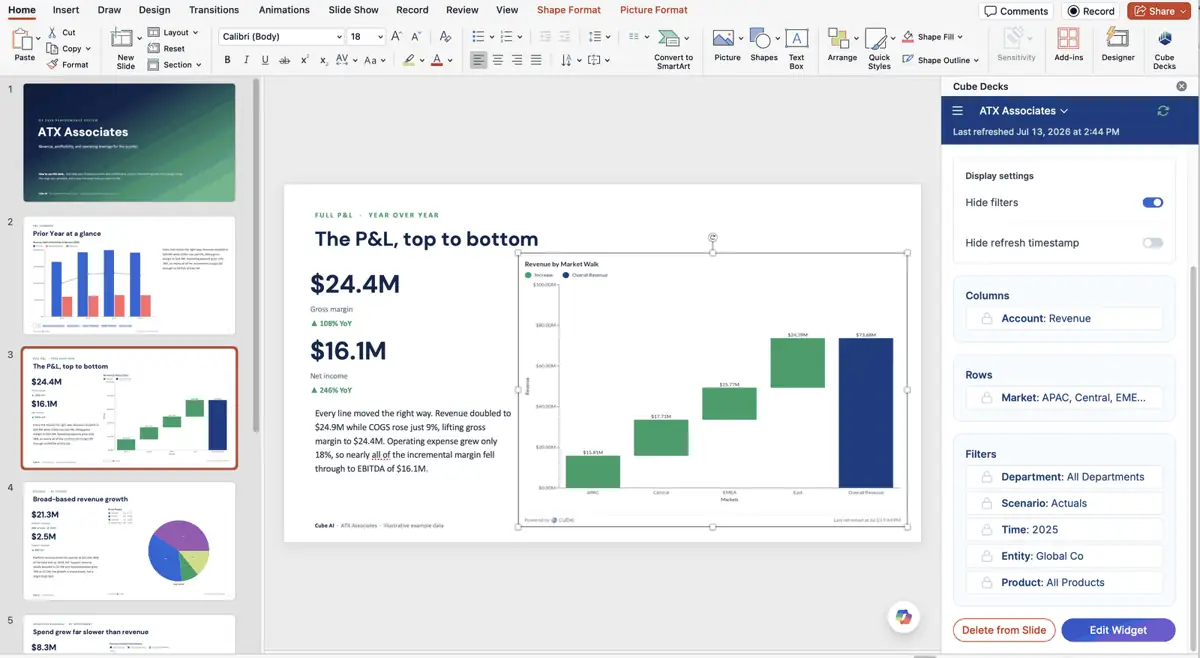
Cube Decks in PowerPoint · illustrative example data
The revenue walk
The chart on slide 12 is live.
This waterfall is a Cube visual, filtered from the panel to any single market and refreshed after the forecast call, so you present it knowing it ties.
Why Cube Decks
Deck week becomes a morning of review.
Refresh instead of rebuild
When the forecast changes, one refresh brings every visual in the deck current.
The slide reads the model
Every chart and table is a governed Cube visual, filtered right there on the slide.
Governed to the cell
Visuals respect role-based access, and every figure traces to the source.
Adoption
Easy to add, with nothing to replace.
Cube Decks drops into the deck templates you already run, on the PowerPoint you already have.
PowerPoint versions
Windows and Mac, Microsoft 365, and PowerPoint on the web.
Can refresh a deck
Refreshing a deck takes no special permission; building visuals does.
Rip-and-replace
Your templates, layouts, and branding stay exactly as they are.
Cube Decks in action
The deck that keeps up with the forecast.
Everything below ships in the add-in today, alongside Cube's FP&Agents.
Ribbon & panel
Insert visuals from the Cube Decks ribbon; the side panel carries each widget's filters and its last refresh.
Refresh vs. build
Any user can refresh a deck. Inserting or editing visuals takes a higher permission, so the deck stays authored.
Business Partner Agent
Live today, it drafts the narrative around your figures: the exec summary, the variance story, the note under the chart.
One prompt, one deck
Through the Cube MCP Server, a single prompt in an AI assistant generates a full PowerPoint: charts, tables, commentary.
On the roadmap for 2026: the Deck Builder Agent, drafting complete decks from a single prompt.
Today and next
What about Google Slides?
PowerPoint has the native add-in today. For Google Slides, linked Cube charts work today, and the add-on is coming soon.


PowerPoint · available now
The Cube Decks add-in
Live visuals inserted from the ribbon, filtered in the panel, refreshed in place. PowerPoint 2016 and later on Windows and Mac, Microsoft 365, and the web.
Get it: Microsoft AppSource.
Google Slides · add-on coming soon
Linked charts, today
Fetch governed Cube data into Google Sheets, chart it, and paste into Slides with Link to spreadsheet. When the sheet updates, one click updates the chart in place. It runs on the same live data as Cube in Excel and Google Sheets.
Coming soon: the native Slides add-on.
See it on your own board pack.
Bring last quarter's deck. We will show you the live version of a slide, on governed data.
Security & governance
The slide respects the same permissions as the model.
Board decks carry the most sensitive numbers in the company, so access rules travel with every visual. The full posture lives in our security overview.
Role-based access
The CFO sees everything. A VP sees their cost center. An external auditor sees read-only with exec comp redacted.
Cell-level security
Enforced at the data layer, so a refreshed slide never shows more than the viewer's role allows.
Full audit trail
Every change in the model is logged: who, when, and the before and after values.
Single sign-on
Okta, Microsoft Entra, and Google, so deck access follows your identity provider.
Walk into the board meeting sure the deck ties.
Book a demo and watch a live Cube visual land in a slide, filtered, refreshed, and traced to the source.
Book a demoExploring the bigger picture? See everywhere Cube works.