The FP&A workspace in your browser.
A home base for every number.
Cube Workspace is the FP&A workspace in your browser: Web Reports, Boards, Workflows, and the AI Analyst, all reading one governed model. Everyone sees the same number, and every number opens to its source. Thousands of finance professionals plan, report, and analyze on Cube.
Problem
You built it in a spreadsheet. Now it’s needed by the whole company.
The model started in a spreadsheet. The people who consume it, approve it, and ask questions about it need a different way in.
Sharing means oversharing
Send the workbook and you send all of it, every tab, every salary. So finance exports PDFs, and stakeholders read stale snapshots.
Your CEO is a viewer
They want one number, on their phone, five minutes before the meeting. A 40-tab workbook is a terrible viewer.
The process lives in email
Budget collection, approvals, deadlines, who's done and who's late: the work around the model runs on threads and reminders nobody can track.
Every question routes back to you
A PDF can't answer a follow-up, so each "why is this up?" lands in finance's inbox and eats an afternoon.
One model
What an FP&A workspace should do
Connect your source systems once, keep one governed model, and deliver it in the browser, where reports, Boards, and approvals stay live. It replaces the manual assembly and reconciliation that consume up to 80% of a finance team’s time.


One governed model
Live in your browser. Permissioned, traceable, current.
- Unified DataOne source of truth for all your business data
- Advanced Business LogicRules, metrics, calculations and consolidations
- AI Agents & AutomationInsights, forecasting, workflows and automation
- Security & ControlsAccess, auditing and compliance
One connection. Trusted everywhere.
Monday morning
An FP&A homepage that starts the day decision-ready.
Sign in and the work is laid out: your reports, pending workflow tasks, connection health, and the AI Analyst ready for a question in plain English.
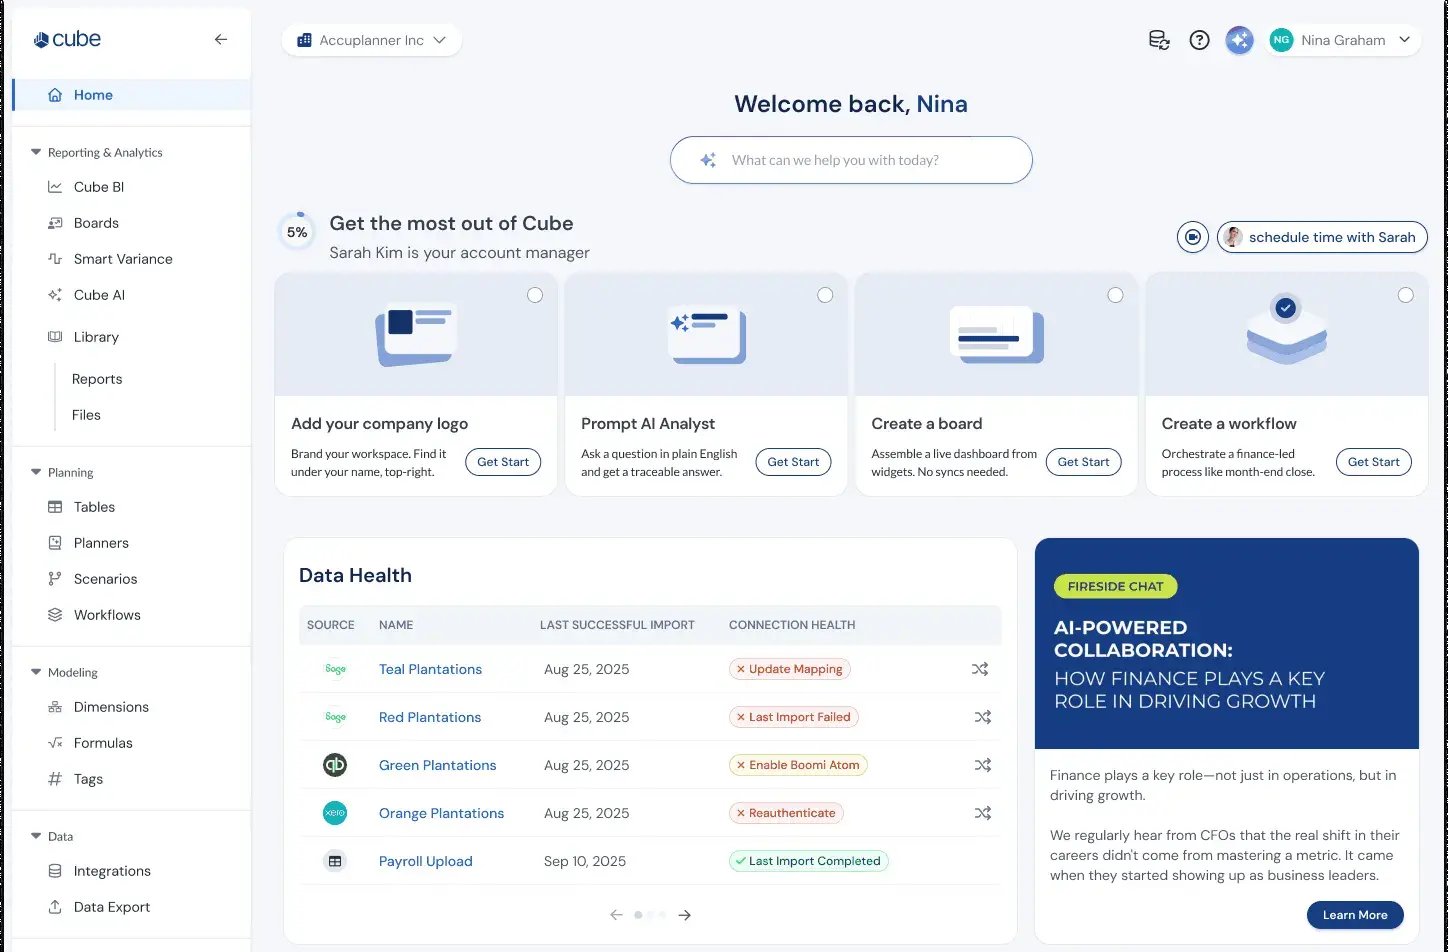
The Workspace homepage: your reports, pending tasks, connection health, and the AI Analyst, laid out at sign-in.
The bridge
From budget to actual, and into the why.
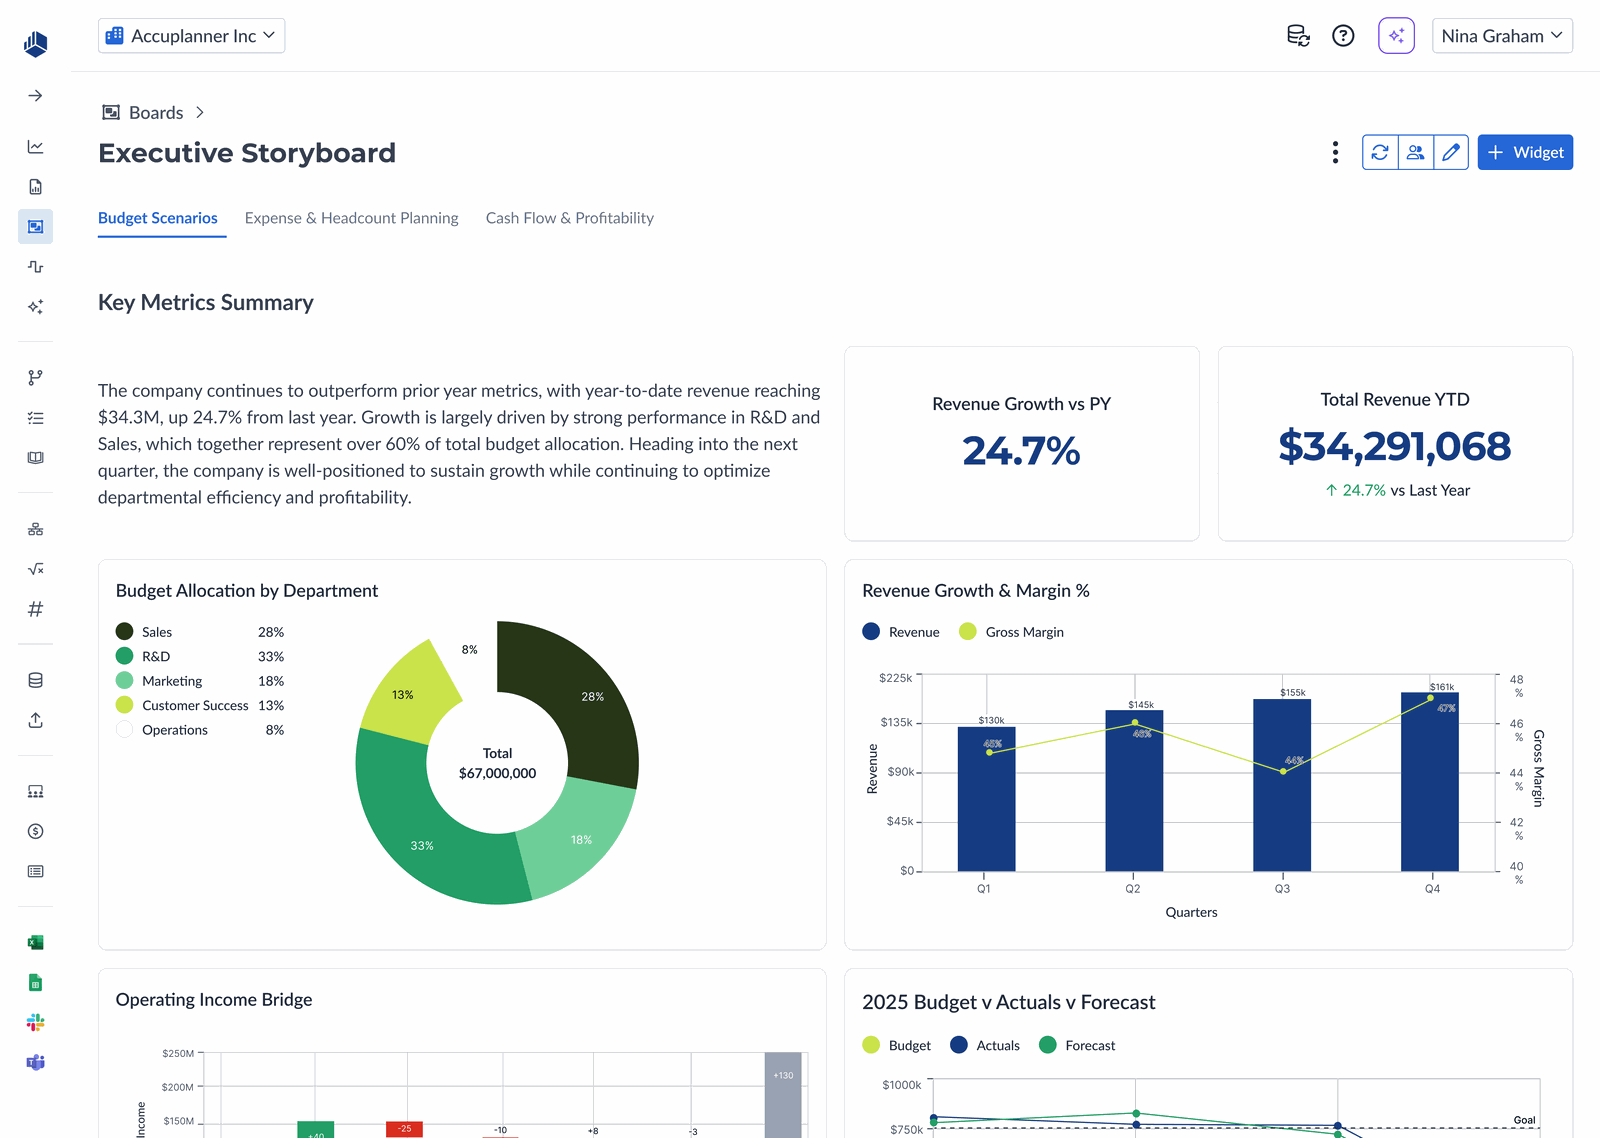
The June opex bridge behind the report above. Every bar opens to the accounts and transactions underneath it.
Why it sticks
Built for the whole company, governed by finance.
One place for the plan
Reports, Boards, tasks, and approvals live on one model, so version control stops being a job.
Spreadsheets stay first-class
Patented bi-directional sync keeps Excel and Google Sheets live with the same model the browser shows.
Accountable by default
Role-based access, a full audit trail, and drilldown to the source ship with every report.
Adoption
Runs alongside everything you already use.
Finance-led and no code, with hundreds of source systems connected through pre-built connectors and flexible methods.
Finance-led setup
Configured by your team, guided by ours.
Source systems connected
ERP, CRM, HRIS, billing, and data warehouses feed one model.
Rip-and-replace required
The Workspace deploys alongside the stack you run today.
Guided onboarding
Hands-on setup with a named contact.
Inside the Workspace
The whole variance review, live in the browser.
Everything below reads the same governed model. And when an exec asks in Slack or Teams instead, the same AI Analyst answers there.
Cube Boards
Live dashboards built from 11 widget types, with the Visualization Agent assembling widgets from a prompt.
Web reports
Save any view as a refreshable, shareable report. The Library keeps version history, and every figure drills down.
AI Analyst
Ask in plain English from the homepage and get answers linked to the exact records behind them.
Workflows
Budget check-ins, variance reviews, and approval chains, with owners, due dates, and email notifications.
Scenarios
Unlimited scenarios side by side, Smart Forecasts as a starting point, and merge when a plan wins.
Permissions admin
User types set feature access, and data access groups scope the numbers, down to the cell.
Use cases
Where the Workspace earns its keep.
Monthly variance review
Open the report, click the flagged line, and answer the why before the meeting starts.
Board reporting
Figures flow from the same model into live slides, so the deck matches the report.
Budget season
Workflows carry owners, due dates, and approvals, so the cycle runs on rails instead of reminders.
Self-serve for the business
Department heads get scoped Boards and Web Publish forms, and see only their own numbers.
Multi-entity consolidation
Intercompany eliminations, currency conversion, and segment rollups run natively in the model.
Scenario planning
Compare downside, base, and upside side by side, and merge the winner into the plan.
See it on your own data.
Bring one messy monthly close. We will run the same review, live, on a model shaped like yours.
Accountability
Every change has a name attached.
The Audit Trail logs the date, the event type, the team member, and the before and after values for every change, filterable in one view.
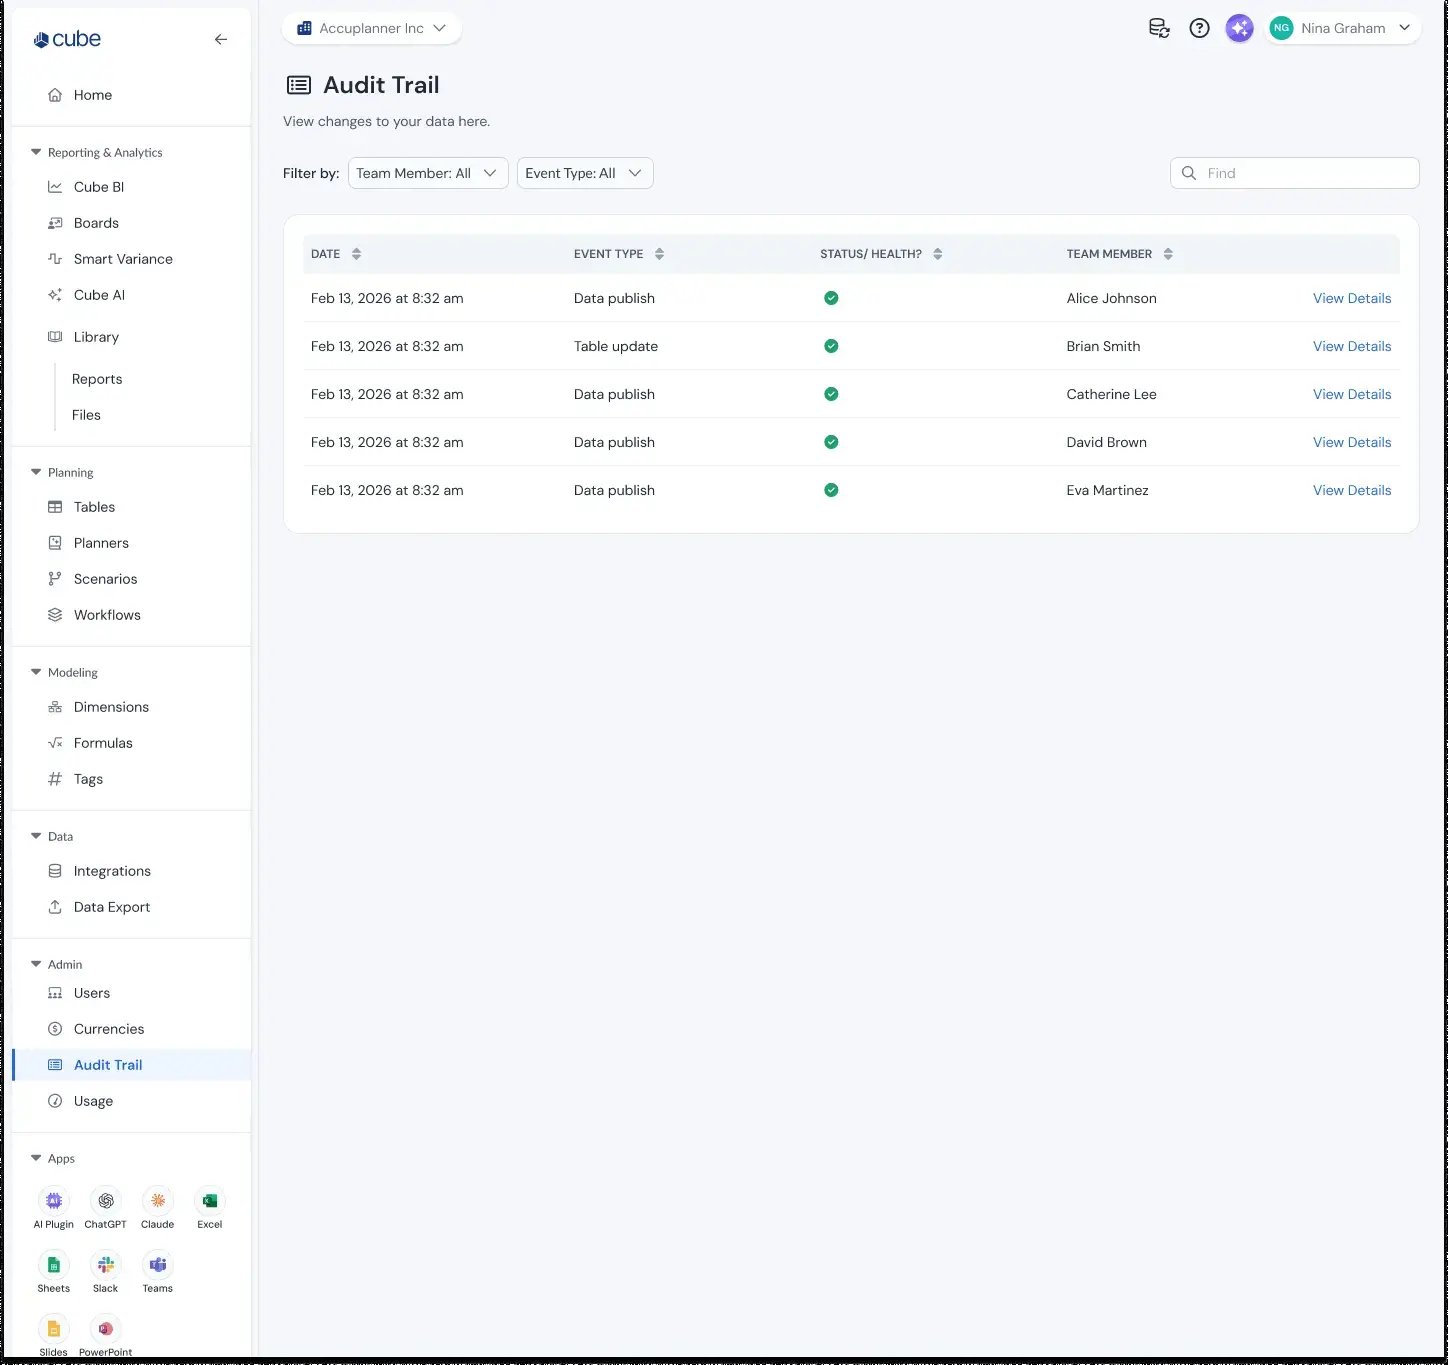
Audit Trail: Workspace changes, syncs, imports, and spreadsheet publishes, all logged. Publishes can be undone.
Security & governance
Access the CFO can sign off on.
The CFO sees everything. A VP sees their cost center. An external auditor sees read-only with exec comp redacted. Same source, different access, enforced at the cell level.
SOC 2 Type II
Independently audited controls; the full posture lives on the security page.
Role-based access control
User types set feature access, and data access groups set data scope.
Single sign-on
Okta with SAML and OIDC, Microsoft Entra, and Google SAML are supported.
Governed AI
AI can be 80% right. In finance, that’s 100% wrong. Every AI answer passes the same permissions before anyone sees it and traces to the source.
Trace to the source
Every number opens to its source.
Every finance leader knows the feeling of presenting a number they can't fully explain. In the Workspace, any figure opens to its accounts and then to the GL transactions behind it. A board slide shows 12% growth; click it and Cube drills past the summary and the formula to the specific General Ledger transactions behind the number.
| Jun 03 | AWS | monthly usage | NetSuite | $84,120 |
| Jun 12 | Snowflake | compute | NetSuite | $31,480 |
| Jun 27 | Datadog | annual true-up | NetSuite | $46,900 |
| + 41 more transactions | ||||
Give every number a home base.
Thousands of finance professionals run planning, reporting, and analysis in Cube. See the Workspace on a live model, shaped like your data.
Book a demoStill exploring? See everywhere Cube works.