Details
Most finance teams have started using AI to ask questions. Fewer have used it to build. The Build It Yourself series is about the second thing: using AI to create real, persisting finance tools that hold up month after month. Not a screenshot of a chat, but working software you deploy once and refresh forever.
This session is about artifacts: live, interactive pages loaded with your real numbers. Think dashboards and reports you filter, drill into, and refresh in a click, instead of rebuilding in a spreadsheet every cycle. Charlie Erlikh from Cube's finance team will walk through what artifacts are, when to reach for one, and how to turn a static report into something interactive your team keeps coming back to.
It's a workshop-style, follow-along session. You don't need Part 1 to join, and you don't need an engineering background. We'll keep it practical and grounded in real finance examples, with time to ask your questions along the way. We'll cover:
What an artifact actually is
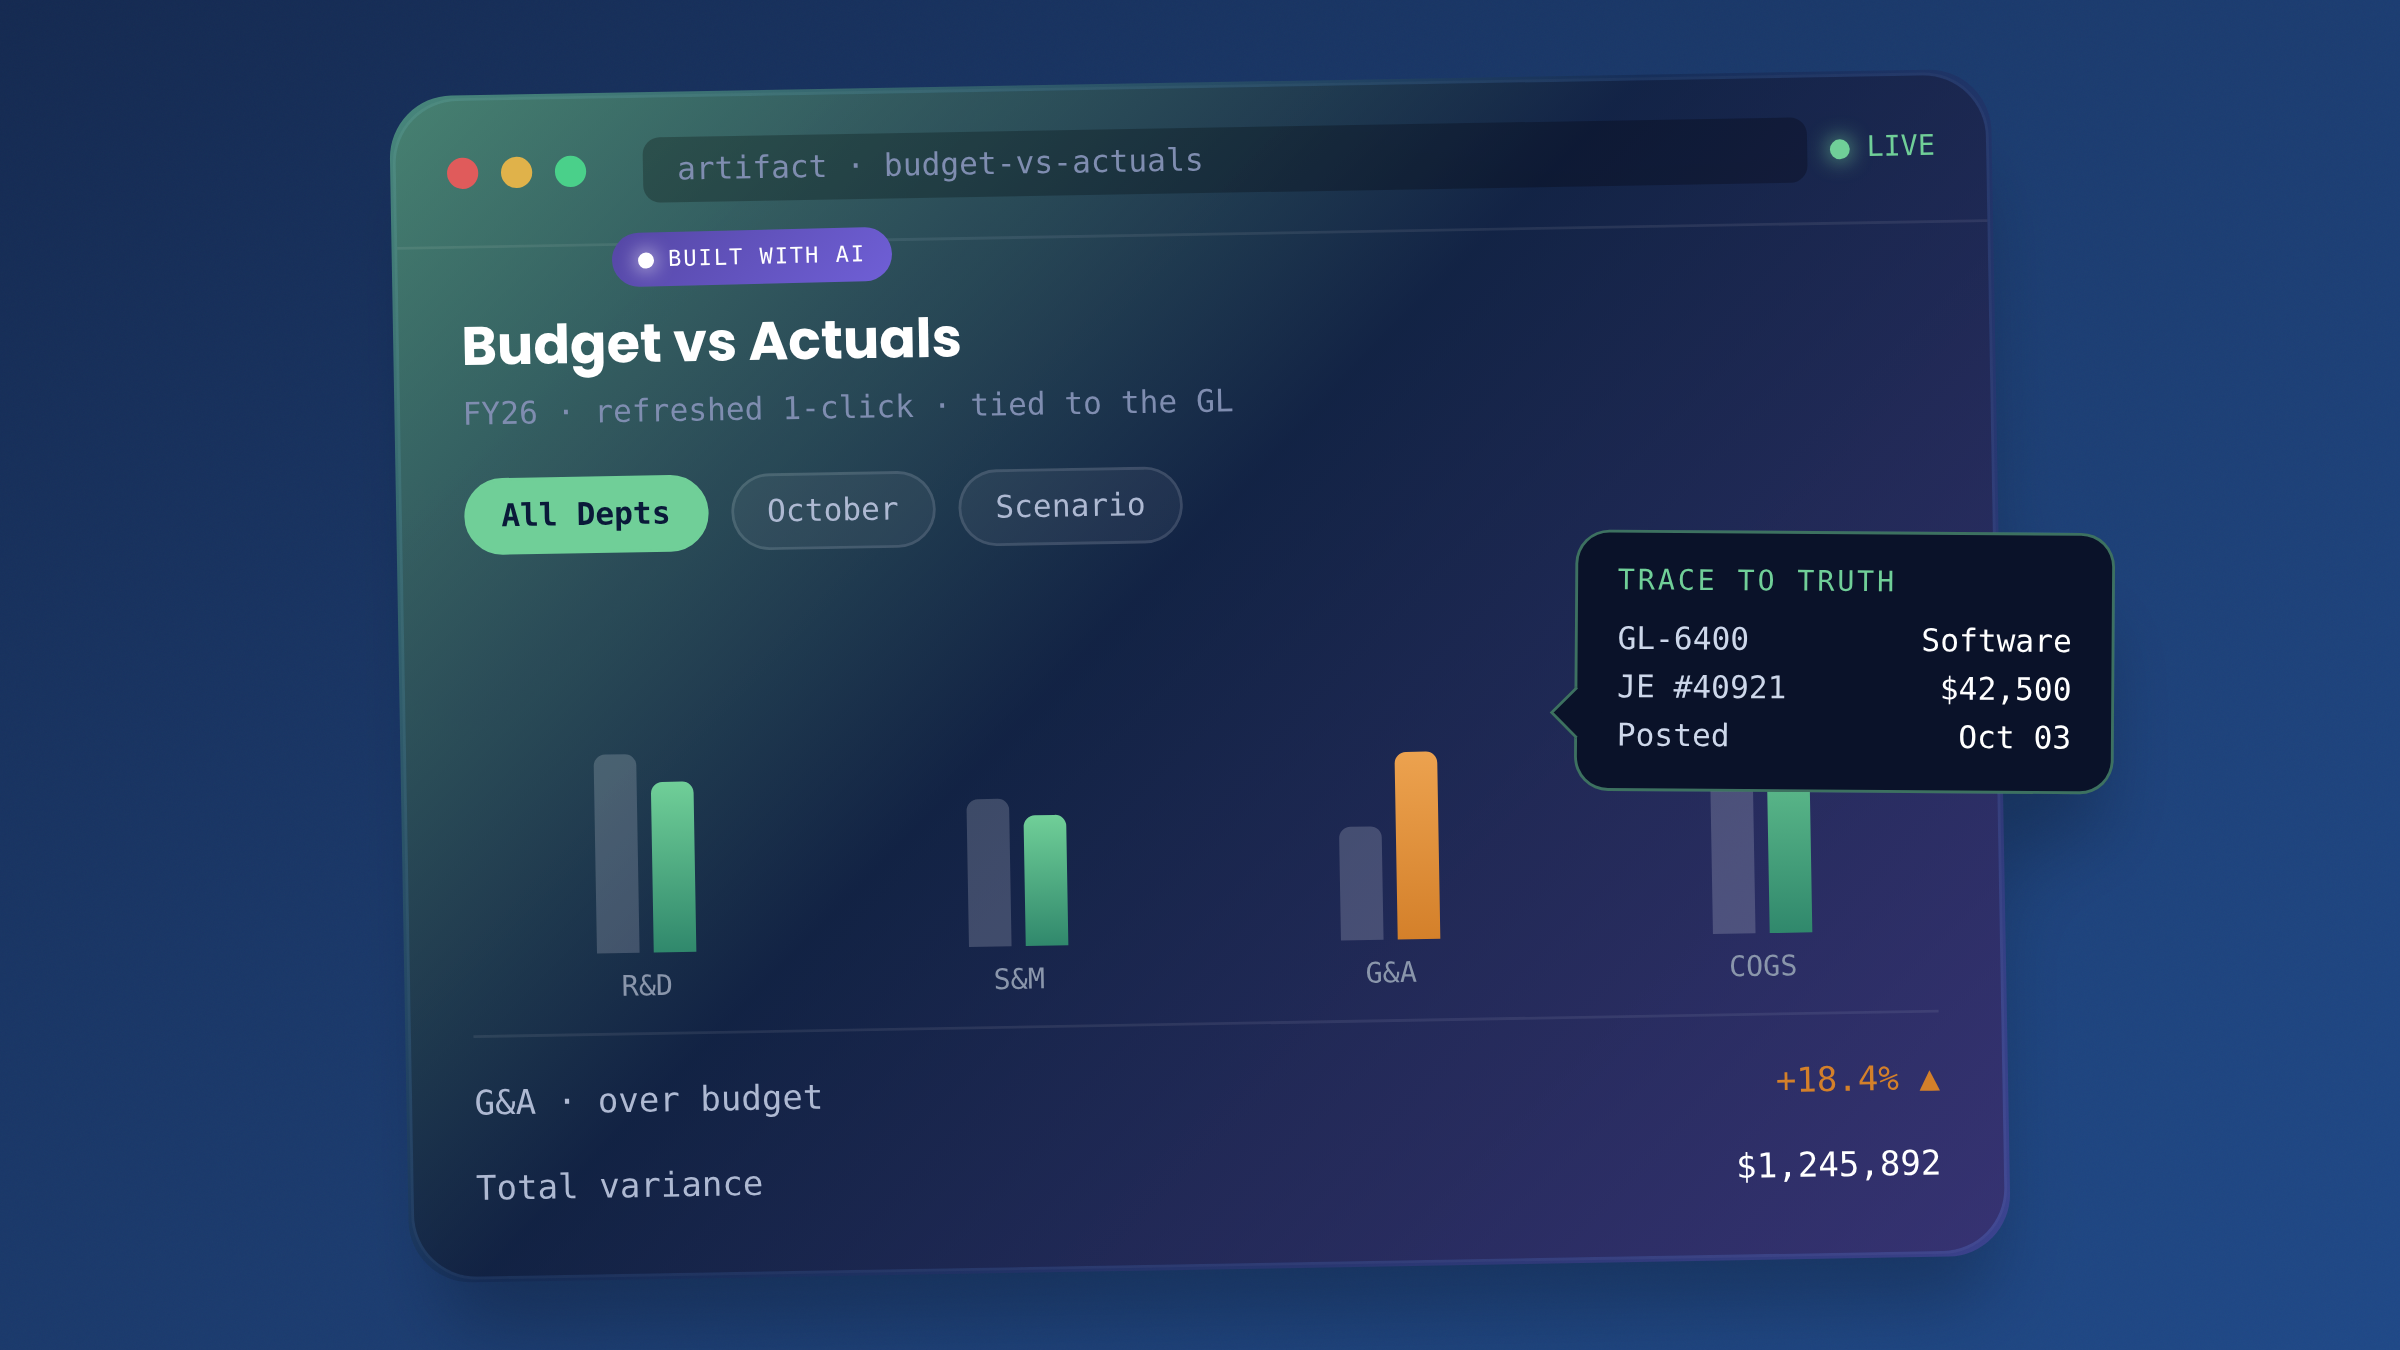
An artifact is a live, interactive page the AI builds for you: a dashboard, a report, a calculator, loaded with your real numbers instead of a static screenshot. You describe what you want in plain English, the AI builds it, and you get something you can click into, filter, and refresh. It doesn't require an engineering background. Where a chat answer disappears the moment you close the window, an artifact persists, so the thing you build today is still there and still working next cycle.
When to reach for one (and when not to)
Not everything should be an artifact. We'll draw the line clearly: a one-off question you ask once is a chat, but a report you rebuild every month, a dashboard three people keep asking you for, or a calculator the whole team reruns is exactly what an artifact is for. The rule of thumb is simple. If you find yourself doing the same assembly more than once, that's the signal to build it once instead.
Turning a static report into something live
The main event is taking a report that today lives as a flat spreadsheet or a slide and rebuilding it as something interactive. We'll start from a real finance example and show the before and after: the monthly toggle, filters by department or period, and the drill-down from a summary number to the detail behind it. Instead of rebuilding the view every cycle, you refresh it in a click and the numbers move with it.
Why the data underneath still decides everything
This is the part finance cares about most, and rightly so. An artifact is only as trustworthy as the numbers feeding it. We'll show why an artifact built on a clean, structured source holds up, and why one built on a messy spreadsheet quietly breaks, with the auditability finance needs: trace any number back to where it came from. The takeaway carries over from Part 1. Building on messy data is still messy. Building on a structured source is reliable.
Prompts to take with you, and what we build next
Throughout the session we'll drop prompts and instructions into the chat that you can copy and paste into your own AI, including the build we walk through live. Because this is part of a series, we'll close by asking what you want us to build next, followed by live Q&A.