Revisiting vertical analysis in financial statements
Financial analysis can get pretty complex. As it gets more intricate, figuring out which data really matters—and what's just noise or not relevant to your company’s goals—can be tricky.
That’s where vertical analysis comes in. Vertical analysis streamlines financial analysis, offering a clear and concise view of the most significant financial metrics. For finance and FP&A leaders, it's a great way to quickly spot any problem areas or parts that need a bit more attention, making their job a bit simpler and more focused.
The vertical analysis formula is as follows:
Vertical Analysis Ratio = Line Item / Base Number (100)
Take, for example, applying vertical analysis to compare employee salaries with revenue. Over three years, you might notice salaries increasing from 31% to 42% of revenue. Since vertical analysis presents results as percentages, it's clear that salaries are rising in relation to revenue changes.
Such a finding deserves closer examination. It could align with a corporate strategy, like an expansion into a new region that's still gaining momentum. Or, it might indicate an excess in company headcount, necessitating a thorough review. In either case, vertical analysis brings such issues into focus in a straightforward manner.
What makes vertical analysis stand out from other financial and profitability analysis methods is its emphasis on relative relationships. FP&A leaders gain insights into financial ratios specific to their business, enabling them to assess whether they're appropriate for the company’s long-term financial health.
This method proves more insightful than relying solely on generic financial ratios or industry benchmarks. While industry comparisons can be helpful, vertical analysis offers direct, context-specific insights without solely depending on external rules of thumb.

Strategic benefits of vertical analysis for FP&A Leaders
Using vertical analysis offers some key strategic benefits to FP&A leaders. Some of these include:
Review of expenses framework
When you apply vertical analysis to an income statement, it lays out a straightforward and transparent picture of a company's spending patterns. This clarity facilitates discussions and strategic evaluations of that expenditure.
For instance, a company might be allocating 23% of its revenue to R&D, but only 8% to marketing. This breakdown prompts important questions: Is this distribution aligned with the company's current goals? Should there be a shift in focus towards investing more in customer acquisition for their existing products or services?
Trend analysis
Vertical analysis becomes even more useful when it’s used to assess changing trends over time. For example, comparing current expenses to previous years as a proportion of revenue is far more useful than looking just at the raw numbers.
After all, as a company scales, you would expect both costs and revenue to go up. Vertical analysis can highlight whether these changes are proportional.
Risk management
If 5% of company revenue was generated through currency movements, and an additional 5% was generated from a business unit with just one client, those represent significant risks to the business.
Vertical analysis can highlight these issues, giving executives the opportunity to make strategic moves to reduce or eliminate them.
Benchmarking
Since every company is different, it can be difficult to compare financial performance or strategic resource allocation, even to direct competitors. Vertical analysis can account for businesses of different sizes or those with multiple departments and product lines, making cohort analysis and the process of comparing profitability much easier.
Vertical analysis in action: income statement insights
Let’s take a look at an example of vertical analysis to see just how useful this financial statement evaluation can be. While this example is not a comprehensive income statement, it will still help illustrate vertical analysis in practice:
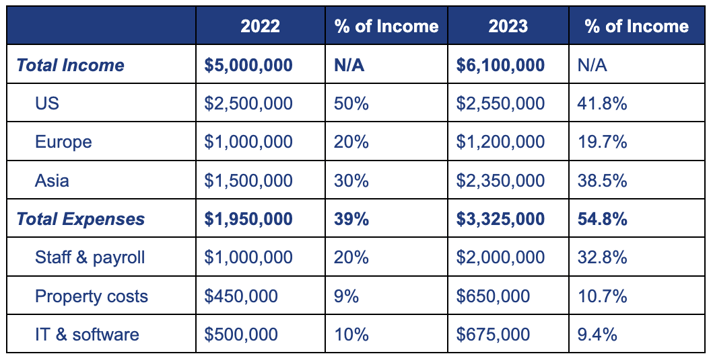
Taking a look at this example, we can see how well it provides a snapshot of the business. While there was a big increase in revenue across the company as a whole in 2023, the majority of this has come from the Asian region. While the US market performance improved, it underperformed the other regions for the year. This could be a normal consequence of a more mature business unit, but highlights a trend worth considering.
From a costs perspective, we can see a big increase in total expenses. IT and software costs have increased on a dollar basis, which could initially cause some concern for FP&A executives looking to cut costs. However, when reviewed against the overall revenue of the business, this line item has actually gone down slightly.
There has also been a substantial increase in staff and payroll costs, which could be an expected part of the strategy leading to increased revenue in Asia, or it could be a worrying trend worth looking at.
This simplicity and clarity enables efficient evaluation of a company's financial health and performance, leading to more effective strategic decision-making by executives. It also helps FP&A teams identify which areas to focus on in their forward planning and projections to boost the bottom line.
Applying vertical analysis to the balance sheet
So far, we’ve focused on using vertical analysis as a way to analyze income statements. However, it can also be used when reviewing the company balance sheet. The same process applies, except the most commonly used denominator is total assets.
Here, analysts and FP&A teams can get a clear view of the company asset allocation, look at how liabilities compare to company assets, and review the equity structure of the business.
It can be used in the same way, identifying whether the current balance matches the strategy of the business, as well as looking at multiple years to identify trends and anomalies. For example, it can be an easy way to track how much of the balance sheet is held in illiquid assets, or to assess how the debt structure has been changing over time.
Vertical analysis applied to the balance sheet complements the insights gained from the income statement. It empowers FP&A teams not only to identify opportunities for boosting revenue or cutting costs in the income statement but also to strategize the optimal allocation of these increased profits as reflected in the balance sheet. This dual approach offers a comprehensive view, enabling a more informed financial strategy that covers both earnings performance and asset management.
All of this serves not only to improve opportunities for long-term growth, but also to ensure that investment strategies for corporate reserves improve financial stability and minimize risk.
Integrating vertical analysis into financial reporting and communication
One of the major benefits of vertical analysis is that it makes it simple to report to and communicate with stakeholders. A ratio-based approach makes it easy to provide a clear picture of financial health, with very little need for background information or detailed notes.
That isn’t to say that presentations to stakeholders or executives should be light on detail, but using vertical analysis in the financial reporting process is a great way to summarize findings and highlight areas for concern.
We often see this approach taken in the earnings announcements for public companies. The initial release will include a summary of financial information that is more interesting or relevant, such as the percentage increase in net income or users, with greater detail provided throughout the rest of the document.
This strategy can save a significant amount of time, as it shifts the focus to the areas of the company's financials that need the most attention. This isn’t about hiding information or presenting an unrealistic picture; it's quite the opposite. It’s about allowing executives and decision makers to drill down to the vital information quickly—without needing to sift through hundreds of pages of financial data.
Of course, there is always a risk that important details could be missed. That’s why FP&A teams should always be sure to add context to the numbers: Why have they been highlighted? What are the key questions surrounding them?
Continuous improvement and adaptation in vertical analysis
Just like any financial statement analysis method, vertical analysis isn't a one-time task. The ratios that made sense for employee salaries in the tech sector in 2005, for instance, wouldn't have been applicable in 2017.
FP&A teams must continuously refine their use of vertical analysis. This involves staying up to date with industry trends and evolving financial practices, as well as evaluating the outcomes of decisions influenced by this analysis. It's crucial to assess whether focusing on vertical analysis of the income statement leads to improvements in the bottom line and the achievement of corporate goals, or if it causes decision-makers to miss the bigger picture.
The effectiveness of vertical analysis will vary from one business to another. It's a key responsibility of the FP&A team to keep track of this and foresee how different strategies might affect the company's finances in the long run.
Adaptability, a proactive approach, and a willingness to embrace change are essential. Relying rigidly on a single method of financial analysis can lead to narrow-mindedness and poor decision-making. Instead, using a variety of analysis techniques and financial analysis software as 'tools in the toolbox' can provide a comprehensive view of the company, leading to more informed and effective decisions.
Conclusion: incorporating vertical analysis
Vertical analysis is a key tool for FP&A leaders to better understand and evaluate financial statements. It helps in making smarter, strategic decisions by offering a clear view of a company's financial situation. This approach is vital for planning and guiding a company's financial future in a straightforward way.
Want to learn how Cube can help you conduct vertical analysis effectively (and in less time)? Request a free demo today.