What is financial variance analysis?
Financial forecasts are only useful when they’re accurate. If you discover a forecast is flawed, there's only one thing to do—determine why, and make adjustments. That's why automated financial variance analysis is a key part of financial planning.
Let’s say you prepare a budget for a project, and you think it’s pretty solid. But after the project is executed, you discover a problem: it ended up costing more than your budget estimated. What happened?
Financial variance analysis would help you answer that question. By rectifying the issue, you can ensure future budgets are more accurate and effective at guiding informed decisions and resource allocation.
A variance refers to any kind of discrepancy between what was forecasted and the actual results. There are two primary types of variances:
-
A favorable variance occurs when the actual financial result is better than the budgeted or planned figure. For example, if the actual sales revenue is higher than the budgeted revenue or actual costs are lower than the budgeted costs.
-
An unfavorable variance occurs when the actual results are worse than the budgeted or planned figure. For instance, if the actual sales revenue is lower than the budgeted revenue or actual costs are higher than budgeted costs.
At first glance, a favorable variance might seem like a good thing. But remember, if there’s any variance at all, it means you aren't optimally allocating resources. That extra money could have been put toward another project!

Types of finance variance analysis
Financial variance analysis is more than just a general overview of your budget. Rather, it's a comprehensive process that provides a detailed understanding of specific accounting categories or business performance metrics—such as revenue or profitability.
By focusing on these aspects, variance analysis can offer more actionable insights that can influence future financial decision-making.
Let's take a closer look at some specific types of financial variance analysis:
Price variance
Price variance analysis looks at the difference between planned-for and actual costs of manufacturing products.
In manufacturing, the standard cost is the expected cost per unit. Similarly, standard quantity is the expected quantity of materials per unit.
The formula for calculating price variance is:
Price variance = (actual cost - standard cost) x actual quantity
Using standard costs allows for more precise variance analysis than budgeted costs. That's because they break down elements like materials, labor costs, or overhead, permitting targeted responses.
Fixed overhead volume variance
Fixed overhead volume variance shows the relationship between your fixed overhead costs (like rent) and production.
Essentially, it shows whether that fixed overhead is cost-effective based on the corresponding level of production. A negative fixed overhead volume variance suggests you're underutilizing fixed resources.
The formula for calculating the fixed overhead volume variance is:
Fixed overhead volume variance = (budgeted quantity - actual quantity) * budgeted fixed overhead rate
Variable overhead spending variance
Variable overhead refers to costs that change based on production levels, like direct labor wages or indirect materials. So, you should be able to project these costs based on past data.
The formula for calculating variable overhead spending variance is:
Variable overhead spending variance = (actual variable overhead rate - standard variable overhead rate) * actual quantity of the cost driver
If actual costs vary from what you projected, you'd use variable overhead spending variance to investigate. Potential issues might include inefficient production processes or an increase in direct material costs.
Key steps in conducting financial variance analysis
Following these steps allows you to pinpoint where your company's performance aligns with expectations and where it diverges, providing you with the actionable insights needed to navigate towards greater financial success.
1. Establish benchmarks
Benchmarks serve as a reference point against which actual business performance can be measured, and they play a pivotal role in revealing the extent of variance in your business operations.
Establishing benchmarks based on historical data, industry standards, and/or competitor performance can help you build specific but realistic targets for your business.
2. Gather and evaluate data
Having established your benchmarks, the next step is the gathering and evaluation of pertinent data sources. This involves collecting actual figures and comparing them to your standard or budgeted figures to identify any variances.
For instance, let's say you want to look at the variance in direct material costs budgeted for a specific period. You'd look at actual costs, standard costs, actual quantities, and standard quantities. Relevant data sources would include purchase orders, material requisitions, and inventory records.
You’d then scrutinize collected data for errors and compare different sources to find inconsistencies.
3. Calculate the variance
When you're looking at a variance between total budgeted and actual costs, determining its size is easy. All you'd have to do is subtract the actual amount from the budgeted amount, and there's your dollar variance.
To display the variance as a percentage, you’d divide the actual amount by the forecasted amount, subtract 1, then multiply the result by 100.
If you're looking at a specific metric, determining variances can be a bit more complicated. Continuing with the example of direct material costs, you'd use the following calculation:
(Actual quantity used x standard cost) - (budgeted quantity x standard cost)
Why so complicated? Well, looking at direct material costs requires the use of standard costs and quantities. This allows for a more granular assessment of the causes of the variance (material waste, production inefficiencies, etc.).
4. Perform trend and sensitivity analysis
Trend and sensitivity analysis allows you to squeeze the most information possible out of your automated variance analysis process.
Trend analysis shows how specific variances are changing over time. This can be helpful in showing how effective your variances analysis is at uncovering the causes of variances.
For example, say you're focusing on a quantity variance. If you notice that the difference between your projected and actual quantities used is decreasing over time, there's a good chance your solution has successfully targeted the cause(s) of the variance.
Sensitivity analysis, on the other hand, helps show which variables are most likely to increase or decrease variance. Here, the variance you're looking at is the dependent variable.
Say the dependent variable is revenue variance. You pair that with an independent variable (e.g., sales volume) and see how tweaking that affects the variance.
5. Interpreting variances
Once you've discovered a variance, the next step will be to determine its significance.
It's important to realize there will always be some kind of variance since even the tightest forecast can't be 100% accurate. The question is whether or not the variance is acceptable, and the answer depends on your company's specific benchmarks.
If you're an organization with low production costs, for example, a 1% variance might not be so important. If you're an organization with a highly efficient production process, though, it may be!
If the variance is something that's occurring across your industry, it may also be considered acceptable. Regardless, it's still important to determine the cause of the variance. Doing so will make you better at forecasting and help you determine a proper response if the variance isn't acceptable.
To determine the cause of the variance, you should:
-
Revisit your budget. Inaccurate expectations can often be blamed for variances. Use historical data and industry benchmarks to readjust and set more realistic targets.
-
Consult other components of your FP&A. For instance, maybe there's been a change in customer demand or regulations you'd discover by evaluating your sales forecast. Involve relevant departments in your investigation, as each will have an innate sense of how much money they need for projects, and what factors might affect their ability to hit targets.
-
List potential causes and prioritize them based on significance and likelihood. You can then analyze these causes through techniques like variance decomposition, regression analysis, and trend and sensitivity analysis. You should also leverage data visualization tools so that you can clearly see the relationship between different variables.
6. Communication and reporting
Once you have your data-backed hypothesis as to the cause of a variance, you'll need to present your findings to stakeholders in a variance report. Possible corrective actions can be devised through a collaborative process (e.g., regular workshops).
Consider both short and long-term solutions and focus on addressing the root cause rather than just treating symptoms. For instance, if the variance in sales revenue is due to ineffective marketing campaigns, a short-term solution could be to target specific customer segments or optimize advertising channels. A long-term solution, however, may involve conducting market research to better understand customer preferences.
Examples of financial variance analysis
1. Revenue variance analysis
This type of financial variance analysis compares the disparity between actual sales revenue and projected (budgeted or forecasted) and digs into the reasons behind that difference.
2. Cost variance analysis
While there are various types of cost variance analysis the most common review fluctuations in direct and indirect costs. Another approach is running a variable and fixed cost analysis to isolate those distinct costs and understand how they affect overall cost structure.
3. Operating expense variance analysis
Operating experience variance analysis breaks down OpEx costs down into categories (which could include personnel costs though that that analysis could also be run separately) and examines any deviations to the budget.
4. Cash flow variance analysis
Cash flow variance analysis lets an organization review fluctuations in cash flow due to day-to-day operations or from financing and loan activities.
5. Budget variance analysis
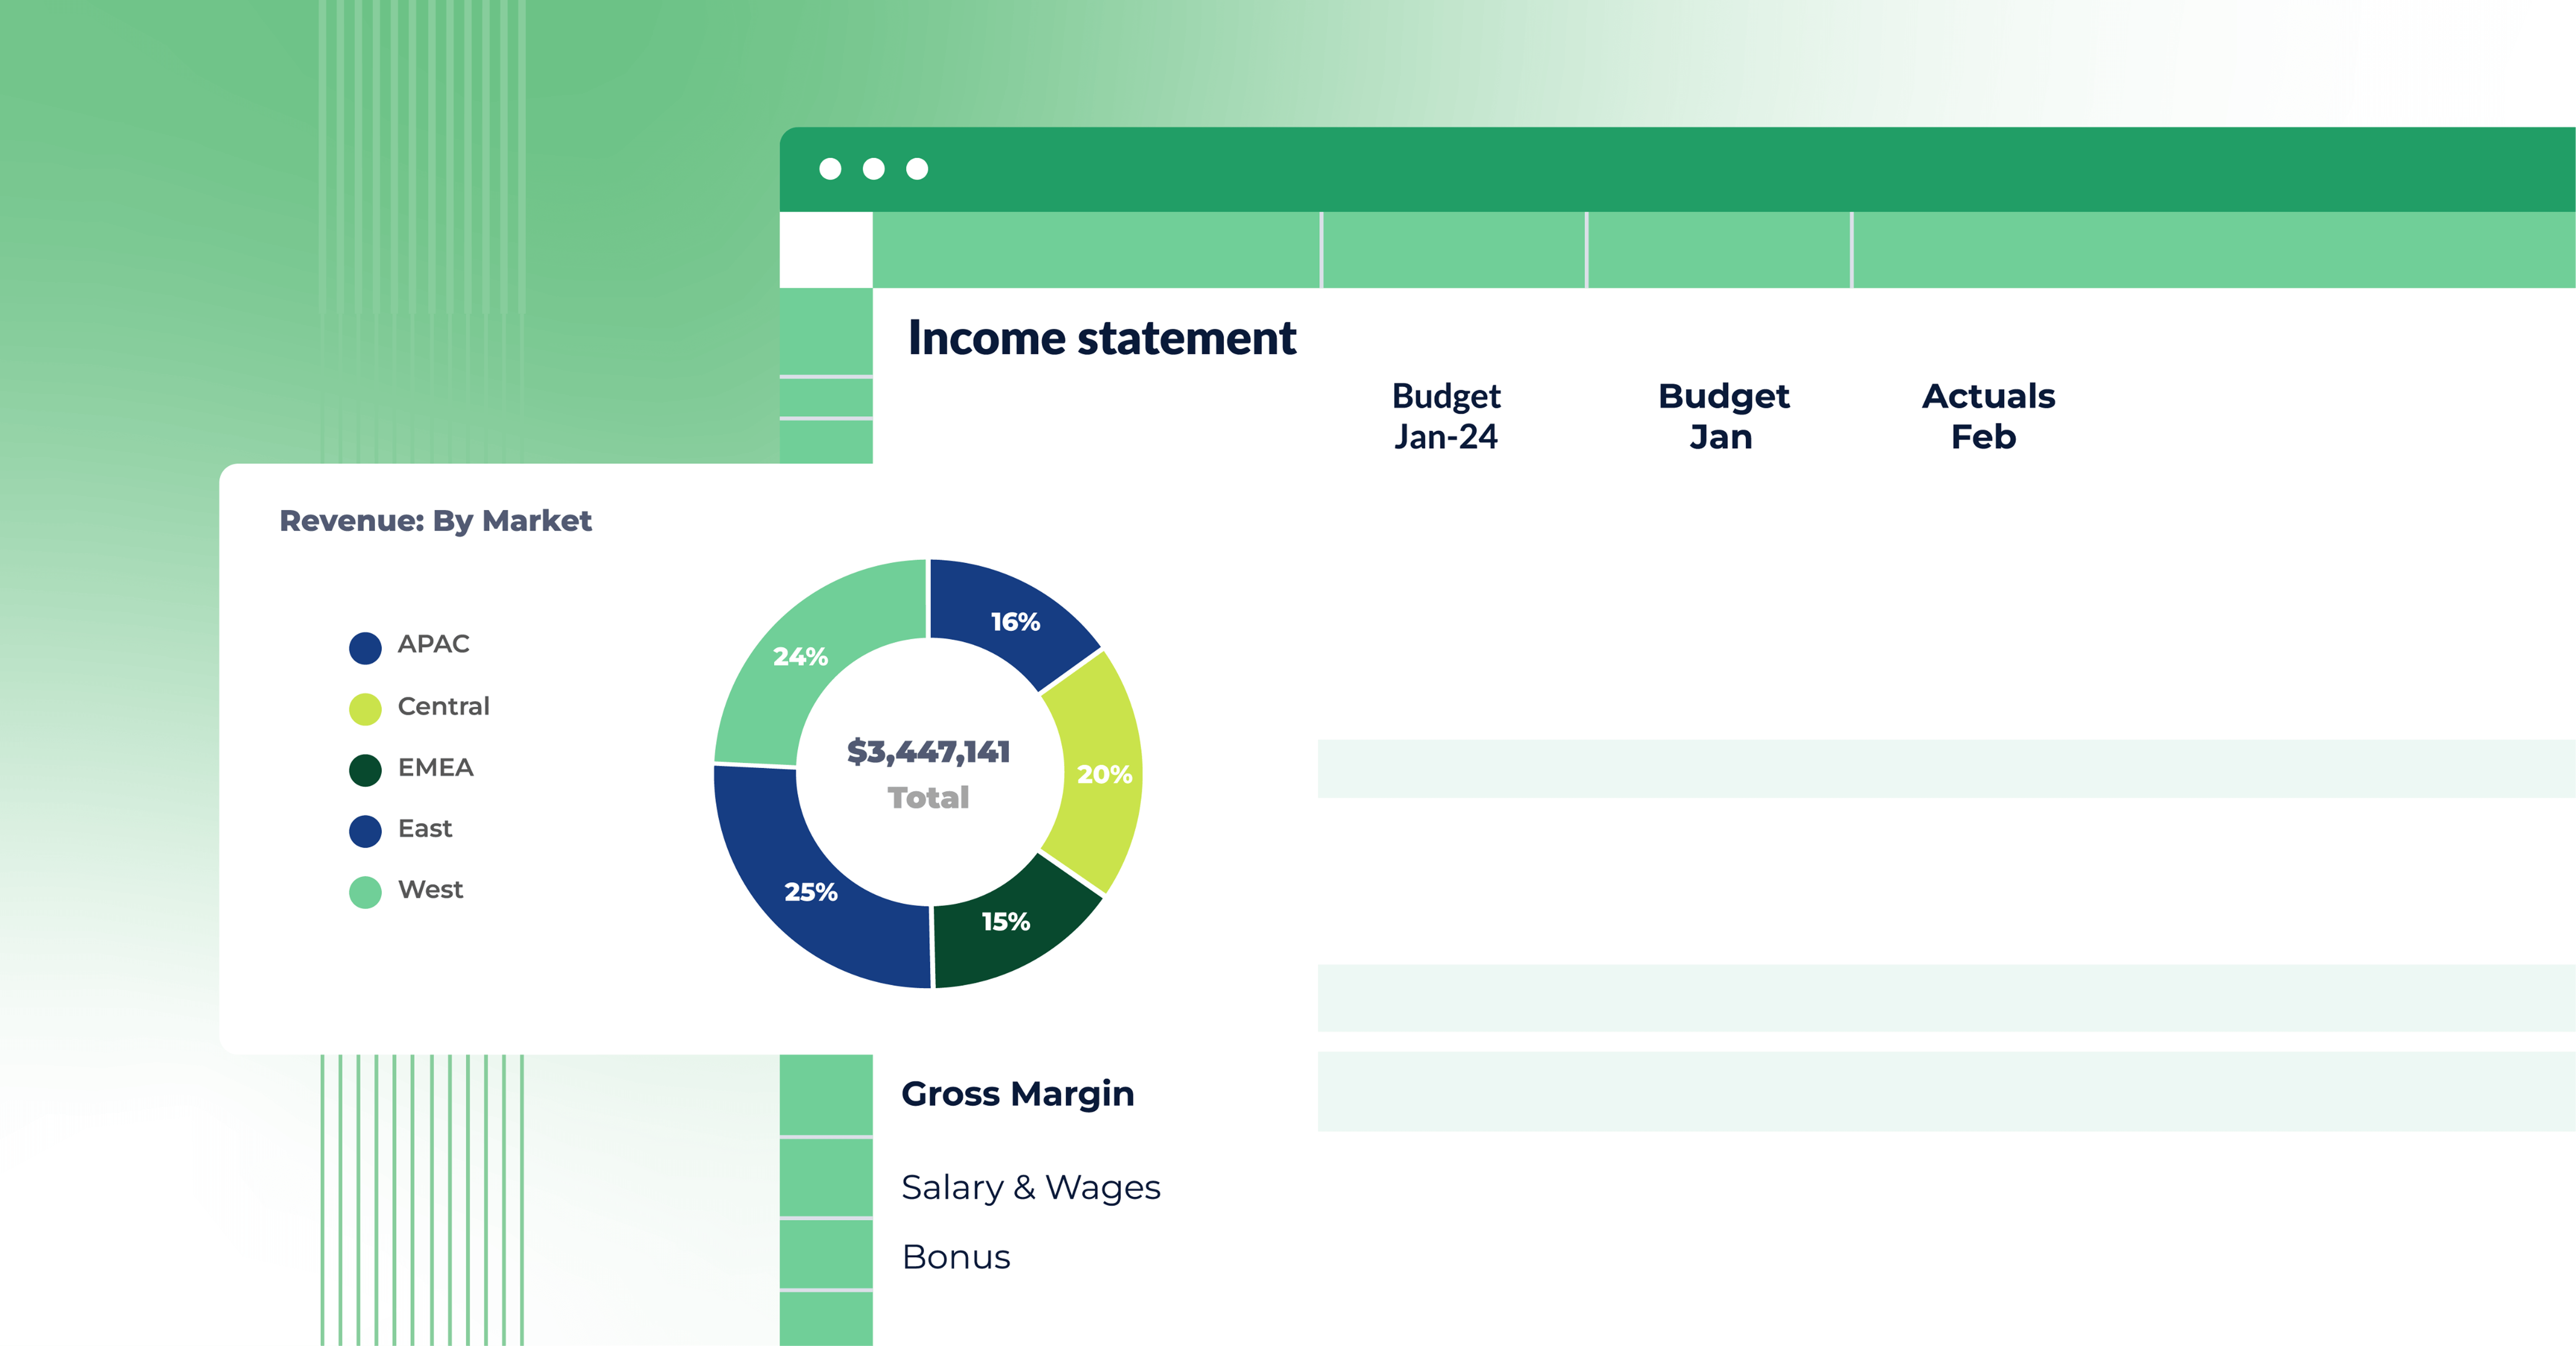
Budget vs. actuals is a typical variance analysis that reviews the key financial statements—income statement, balance sheet, and cash flow—against actual financial results.
6. KPI variance analysis
Often done on a quarterly basis, KPI variance analysis helps an organization better understand how well they performed against the KPIs they set for themselves.
Variance analysis for small vs. large scale projects
Variance analysis for small vs. large scale projects requires different scaling techniques.
Small-scale projects benefit from a streamlined focus on key financial metrics, enabling simplified analysis and rapid response to variances due to more direct management oversight. This scale often allows for more agile adjustments with automated variance analysis:
- Quicker implementation of corrective actions
- Easier tracking and management of financial outcomes
In contrast, large-scale projects demand a more comprehensive approach, involving extensive data collection across multiple departments. This necessitates the use of advanced analytical tools and often requires a significant degree of cross-functional collaboration:
- Integration of diverse data sources for a holistic view
- Strategic, long-term planning based on variance insights
Both scales demand a clear understanding of project objectives and a structured approach. However, the scale significantly impacts the complexity and scope of the analysis, with larger projects often involving more stakeholders and requiring a more detailed and strategic focus.
Navigating pitfalls in financial variance analysis
In financial variance analysis, it's crucial to avoid certain pitfalls to ensure accurate and effective results:
Over-Reliance on Historical Data: Avoid using outdated benchmarks that don't reflect current market conditions.
Ignoring External Variables: Be aware of economic shifts or industry trends that can impact financial outcomes.
Not Differentiating Between One-Time and Recurring Variances: It's important to distinguish between anomalies and ongoing issues. One-time variances might need different treatment compared to recurring ones.
Neglecting the Impact of Seasonality: Some variances are due to seasonal factors. Recognizing and accounting for these patterns is important for accurate analysis.
Best practices for FP&A leaders
Now that you know which steps to include in your financial variance analysis, here are a few best practices to help ensure its effectiveness (spoiler: variance analysis software could make your life even easier).
Emphasize the importance of collaboration and cross-functional communication
The finance function doesn't operate in isolation. It's interconnected with all other business areas. Therefore, fostering cross-functional collaboration and communication is critical.
By working closely with other departments, you can gain comprehensive business insights and ensure that financial forecasts are firmly grounded in the realities of the company’s operations. Regular interactions can keep everyone aligned on objectives, enabling a holistic and more accurate forecasting process.
Develop a culture of data-driven decision-making
Embedding a culture of data-driven decision-making within finance teams can significantly enhance forecasting accuracy.
Encourage your team to base their predictions, assumptions, and strategic choices on reliable and relevant data. By leaning into the facts and figures, your team can move beyond guesswork and intuition, making informed decisions and forecasts that are rational, informed, and defensible.
Establish regular review and adjustment cycles for forecasts
Financial forecasts should not be set in stone. They need to evolve with changing business conditions and new information, so it's important to establish regular review cycles where forecasts are examined in light of the latest data. Many businesses run monthly variance analysis cycles to keep their finger on the pulse of their financial performance.
If a significant fluctuations are found in the variance data, forecasts should be adjusted accordingly. This approach ensures your forecasts remain relevant and accurate, reflecting the current state of your business and the market.
Leverage technology and automation
Leveraging technology and automation is key to efficient financial variance analysis.
Modern FP&A tools, like variance analysis software, can automate data collection and analysis, reducing manual effort and the risk of errors. They can also provide real-time insights and predictive analytics capabilities that can greatly enhance the accuracy of your forecasts. Embracing technology can not only make your FP&A processes more efficient but also enable more sophisticated and accurate financial forecasting.
By implementing these best practices and using variance analysis software, you can ensure that your financial variance analysis truly serves its purpose—enhancing the accuracy of your financial forecasts and guiding your organization's financial planning goals.
Conclusion: enhance forecasting accuracy one step at a time
Financial variance analysis can act as a compass guiding your business toward its financial goals. It offers a lens to closely examine deviations in your financial performance, allowing you to refine your forecasting process and enhance accuracy.
Following these steps is an excellent way to set your business up for success—though using variance analysis software could make your life even easier. To learn how Cube can further simplify the forecasting process and boost your company’s chances of hitting its numbers, request a free demo today.