What is vertical analysis?
.png?width=577&height=325&name=Employee%20Turnover%20Rate%20(5).png)
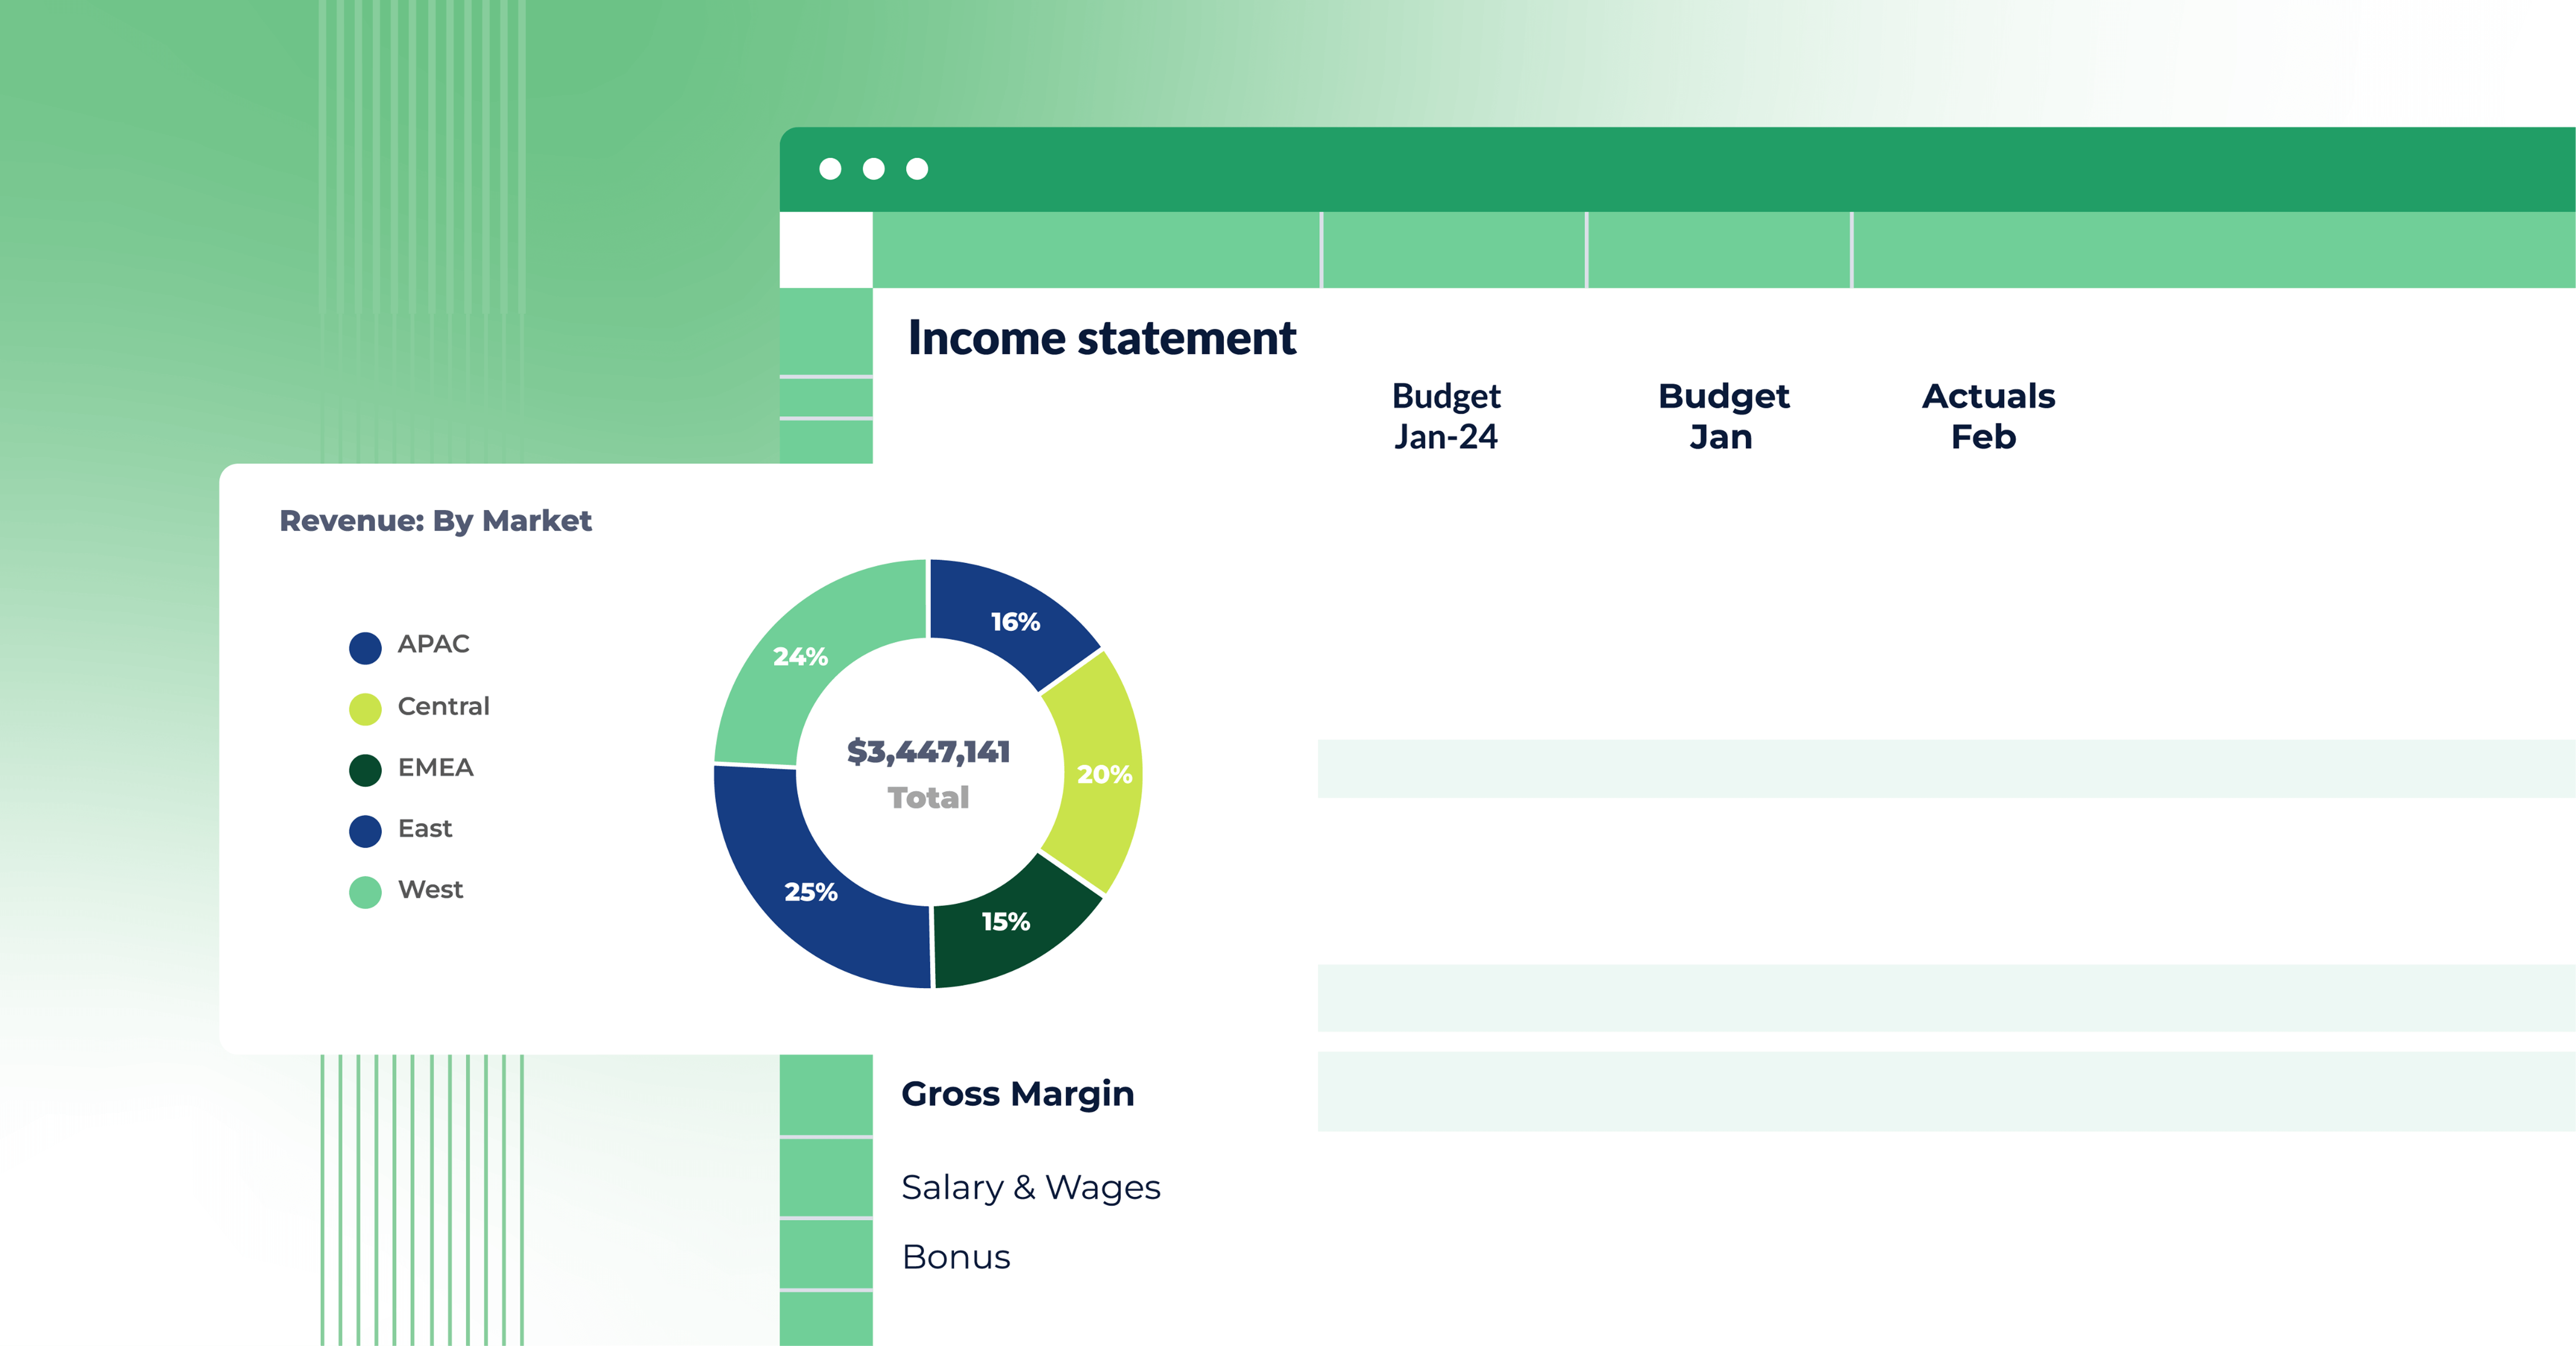
Vertical analysis is a method used in financial reporting where each line item on a financial statement is listed as a percentage of another item. This allows finance teams to see the relative sizes of accounts.
Vertical analysis can be applied to income statements, where items are often expressed as a percentage of sales, or balance sheets, where items are shown as a percentage of total assets.
The benefits of vertical analysis
Vertical analysis can be incredibly beneficial to finance teams. Some of the key benefits include:
- Comparability across different scales: With vertical analysis, finance teams can compare companies of different sizes (or the same company over different periods) by expressing line items as a percentage of a base figure. This standardizes financial statements and allows for more meaningful comparisons.
- Efficiency and cost management: Vertical analysis breaks down how each component contributes to the total. This makes it easier to spot areas where your company may be overspending or underperforming, offering clear targets for improving operational efficiency and cost control.
- Trend spotting over time: Vertical analysis can reveal trends within financial statements when performed across multiple time periods. For example, it may highlight increasing costs or declining revenue, warning you about potential issues early on.
- Simplified financial analysis: Vertical analysis simplifies complicated financial statements, making it easier for stakeholders to understand the financial health and performance of a business without needing in-depth financial expertise.
- Strategic decision support: By highlighting the proportional significance of each line item, vertical analysis enables finance leaders to focus on areas that have the greatest impact on the company's financial health and strategic goals.
How to conduct vertical analysis
Conducting vertical analysis starts by selecting a base amount for each financial statement. For an income statement, this might be total revenue or net sales. For a balance sheet, it might be total assets or total liabilities and equity.
Next, you would calculate the percentage that each line item represents of that base amount. This process turns financial statements into digestible, comparative data. To calculate the percentage that each line item represents of the base amount, you can use the following formula:
Percentage of base amount = (Line item amount / Base amount) * 100
For example, let’s say your company's cost of goods sold (COGS) is 40% of total sales one year. Then the next year, it rises to 50%. Vertical analysis would help you quickly flag this increase, allowing you to dig deeper into potential causes like rising material costs, pricing strategies, etc.
Best practices for using vertical analysis
When conducting vertical analysis, be sure to follow these best practices to get the best results:
- Use consistent base amounts: When comparing different periods or companies, always use consistent base amounts. This ensures your analysis is both accurate and relevant.
- Use industry benchmarks: Compare your vertical analysis results with industry averages or benchmarks to understand your position relative to competitors.
- Ensure comprehensive coverage: Apply vertical analysis to both the income statement and balance sheet to get a complete picture of financial health.
- Regularly review your numbers: To track changes in your financial structure over time, make vertical analysis a regular part of your financial review process.
What is horizontal analysis?
.png?width=577&height=325&name=Employee%20Turnover%20Rate%20(6).png)
Horizontal analysis, also known as trend analysis, involves comparing line items in financial statements from one period to the next, either in terms of absolute changes or percentage changes.
This type of analysis is useful for spotting trends, understanding growth patterns, or identifying potential financial concerns.
The benefits of horizontal analysis
There are plenty of advantages to using horizontal analysis in financial planning. Some of the key advantages include:
- Trend identification: Businesses can use horizontal analysis to identify trends over time, highlighting areas of growth, stability, or decline in financial performance. This is crucial for long-term strategic planning and forecasting.
- Performance evaluation: Companies can compare their financial performance against industry benchmarks or competitors, gaining insights into their competitive position and market performance over time.
- Financial health assessment: Finance teams can use horizontal analysis to identify changes in financial statement items over time. This makes it easier to keep tabs on the business’s financial health and spot any areas of concern.
- Informed decision-making: Horizontal analysis provides a clear picture of financial trends and their implications on a business. This can be especially helpful for management when it comes to making informed decisions related to budgeting, investing, and operational strategies.
How to conduct horizontal analysis
Performing horizontal analysis involves a few straightforward steps. First, you’ll decide which financial periods you want to compare. This could be consecutive years, quarters, or months, depending on the level of detail you need.
Then, for each line item you're analyzing, you’ll want to calculate both the absolute change (the difference in value from one period to the next) and the percentage change (the rate of change over time).
Absolute change = Value in current period − Value in previous period
Percentage change = (Absolute change / Value in previous period) * 100
Imagine that a company has been gradually increasing its marketing expenditure over five years. With horizontal analysis, the company could:
- Quantify exactly how much the marketing budget has grown each year
- Evaluate the effectiveness of this increased spend in terms of revenue growth
- Use these insights to make informed decisions about future budget allocations
Best practices for using horizontal analysis
When conducting horizontal analysis, be sure to follow these best practices to get the best results:
- Select relevant periods: What is the objective of your analysis? Be sure to choose comparison periods that are relevant to this objective and consider seasonal variations and business cycles.
- Focus on significant changes: Pay special attention to line items with significant changes in absolute or percentage terms. These changes may indicate underlying issues or opportunities.
- Contextualize findings: If there are any significant changes, try to understand the reasoning behind them. Consider external and internal factors like market trends, operational adjustments, and strategic decisions to contextualize your findings.

Integrating vertical and horizontal analysis for strategic FP&A
We’ve already discussed how vertical analysis and horizontal analysis benefit finance teams on their own—but when combined, they can provide finance teams with an even greater understanding of their company's financial health.
Imagine looking at a building from only the front view. You’ll get a certain idea of its design—but once you also look at it from the side, you’ll start to understand its depth and structure much better.
Vertical analysis is like viewing the building from the front. It looks at financial statements to see how each part relates to a whole within a single period. Horizontal analysis, on the other hand, is like viewing the building from the side. It compares those parts over different periods to help you understand its changes over time.
By combining both types of analysis, you get a fuller, more detailed picture of your company's financial health and performance trends, allowing you to make more informed decisions.
There’s just one question: how do you integrate vertical and horizontal analysis into the FP&A process?
Start by using vertical analysis to understand the proportionate importance of each financial statement item at a specific point in time. Then, use horizontal analysis to track how these proportions change over time. This cross-analysis will reveal your company’s current financial composition and how that composition evolves over time, making it easier to spot underlying trends and anomalies.
The insights gained during this process can significantly inform strategic planning and investment decisions. For example, identifying a consistent increase in cost of goods sold as a percentage of sales (from vertical analysis) alongside overall revenue and gross profit growth (from horizontal analysis) may prompt strategies to improve cost efficiency or pricing models.
Challenges of integrating vertical and horizontal analysis
While they can certainly be beneficial, applying vertical and horizontal analyses in the midmarket segment comes with its own set of challenges.
These challenges may include:
- Resource constraints: Mid-market companies may have limited resources for conducting in-depth financial analyses. If resource constraints pose a challenge for your team, try prioritizing analysis on key financial areas and leveraging technology, like FP&A software, to streamline the process.
- Low data quality and availability: For mid-market companies, ensuring the quality and availability of financial data can be more challenging because they often have fewer resources and less advanced systems for managing financial information. It's important to implement strong data management systems and processes for handling data correctly to make sure your analysis is accurate.
- Learning curve: Integrating vertical and horizontal analysis effectively requires a certain level of expertise. Mid-market companies might need to invest in training or hire personnel with the necessary analytical skills.
Addressing these challenges and thoughtfully integrating vertical and horizontal analysis can enhance your FP&A processes, lead to more informed strategic decisions, and improve financial performance.
Conclusion: see the bigger picture
Vertical and horizontal analysis are key for anyone in FP&A looking to get a clear picture of their company’s financial situation. Together, they can help you see not just where your business stands today, but how it’s been moving over time—and where it’s headed in the future. Be sure to follow the tips provided to pinpoint where your company is doing well and where you need to improve.
Want to learn how Cube can help make this process easier and more efficient? Request a free demo today.