What is budget variance analysis?
Budget variance analysis is a fancy term for when management compares a company’s budget to what was actually spent.
Understanding any overspending or underspending with this method can help improve future budgeting, understand spending better and, if caught early enough, stop any financial disasters from happening.
Every company sets a budget for how much they’ll spend on what. But how do you know if spending is on track, or if the best-laid plans have gone awry? That’s where budget variance analysis comes in.
It’s just like a compass, providing direction and guidance to keep the ship heading towards its destination. Ahoy, captain.
Why is budget variance analysis important?
Budget variance analysis helps business leaders to understand why a business’ budget has or hasn’t stayed on track.
It’s a nifty way to examine whether a new marketing campaign has driven revenue up or if a department’s increased turnover has resulted in an overspend for recruitment.
The financial impact can therefore be assessed and the findings used to inform future budgets.
Budget variance analysis is also useful for determining whether targets are on track and if a course correction is needed at any point in the budgeting period. It’s a vital part of financial planning for companies looking to get more strategic with their finances.
It’s also handy for investors or stakeholders to understand how well a business runs. If a company has repeated negative budget variances, this could indicate that a company is either underperforming or overspending.
And lastly, they’re not just about the financials. You can also use budget variance analysis for quantity, which is useful for companies in manufacturing or construction, as some examples.
Benefits of budget variance analysis
The last thing any company wants is to end the financial year and face a black hole of costs and spending that can’t be explained.
That’s where budget variance analysis comes in.
In short, you gotta have it.
But here are some more detailed reasons why your business would benefit from a forensic investigation of the financials.
Keep goals on track
Every business has its hopes and dreams it’s working towards. A regular review of the budget to make sure everything’s on track also helps to keep those objectives in line, too.
With enough regular reviews (rather than just once a year), you keep your eyes on the road instead of the rearview mirror. Those budget deviations can be quickly corrected so your company goals can stay the course.
Improved budgeting
It goes without saying that questioning why things have happened in the budget and changing them as needed will better inform the next budget process.
By learning from past variances and how they’ve been handled, teams can take these learnings for the future.
This makes budgeting quicker, easier, and less laborious all around. A win-win.
Enhanced decision making
Regular budget variance analysis can help determine whether a company is set to hit its budget goals for the month, quarter, or year.
Assessing why an overspend or underspend has happened also gives executives better insights into why the deviations occurred.
Armed with this information, business leaders can make better-informed decisions on what, if anything, needs to change to improve business processes and spending.
Costs optimization
Cash flow can go south fast when a company spends too much money.
Understanding where and why the expense variations are happening with budget analysis is a great way to keep on top of controlling costs more effectively and spotting any niggling inefficiencies in the company that could be solved.

A deeper dive into budget variances
The truth is budget variance is a bit of a catch-all term. There are important intricacies to understand around the process to get the most out of the analysis. Let’s get into the specifics.
Flexible and static budgets
The good news is budget variance analysis can work for fixed and static budgets, though the way it’s done and interpreted is different for each.
With a flexible budget that can be adjusted to match sales or revenue levels, management can better see the reason behind a variance because the comparisons can be more accurate.
As for a static budget, the clue’s in the name—even if the future assumptions change, the budget can’t be amended.
Variable and fixed variances
Any variances or differences in the budget are usually split into two categories: variable variances and fixed variances.
The former is anything like the predicted cost of raw materials versus the actual cost, whereas the latter concerns differences in the fixed overhead expense budget versus the actual expenses.
Expense and revenue variances
Let’s get even more granular. Budget variances can have expense variances and revenue variances. Expense variances are the fees on the ground, such as any differences in labor costs, office rent, or spending on equipment.
These are much easier to control if a business needs to realign its spending to fit the budget.
Revenue variances are the difference between the predicted and actual revenue.
For instance, if the sales volume were higher than anticipated, this would lead to an opportunity to study why the better-than-expected results happened and how the company could replicate the success in the future.
Favorable and unfavorable variances
As for knowing whether a budget variance is good or bad? A favorable budget variance is when the actual figure is lower than the budget figure. In short, the company’s saved some cash and it’s party time.
For revenue, a favorable variance is when the actual revenue is higher than expected - another reason to celebrate. Or in terms of quantity, a favorable quantity variance is when fewer materials were needed for production.
Unfavorable budget variances, also known as negative variances, are the opposite. In terms of expenses, the actual expenses are higher than the predicted costs, so the organization is spending more than planned.
As for unfavorable revenue variance, this is when sales fall short of what’s expected. The business needs to reassess what went wrong to try and hit targets in the next financial reporting period.
Or with an unfavorable quantity variance, more materials or labor hours were needed than budgeted.
That’s a whole lot of variances—and a lot of analysis needed on a regular basis to keep on track. That’s why companies prefer to use specialist software to make the process easier.
Budget variance analysis formulas
You need the right documents and some math skills to calculate budget variance. The formula at its core is very simple:
Budget variance = Actual amount - Budget amount
It’s the context around the figure that provides the real insights. For example, if a company had $10,000 allocated for its monthly advertising spend but the actual expense was $2,500, the budget variance would be $2,500.
This then allows the business to investigate why that happened. Does management need to review the advertising strategy, or should costs be more tightly controlled in the coming months?
Without the analysis, the figure is just that: a number.
The formulas FP&A teams use to calculate budget variances fall into two categories: dollar and percentage. Let’s take a look at those.
Dollar variance formula
The dollar variance formula follows the same steps as the basic calculation:
Dollar variance = Actual amount - Budget amount
So if we use the same example as above, we’d still reach the $2,500 figure.
We can then use that to inform the percentage variance formula.
Percentage variance formula
Once you have the dollar variance, you can work that out as a percentage.
Why?
Sometimes it helps to give more context to the numbers.
The percentage variance formula looks like this:
Percentage variance = (Dollar variance / Budgeted amount) x 100
So let’s take that $2,500 overspend in the advertising budget example and apply it here:
($2,500 / $10,000) x 100 = 25%
So now the business leaders know the advertising budget has run over by a hefty 25% for the month, they can assess what steps should be taken to rectify the situation for next month.
How to do budget vs. actual variance analysis
Performing the budget analysis process might seem daunting, but luckily, it’s a simple enough task.
Here’s a step-by-step guide on how to perform budget variance analysis.
Find the budgeted and actual figures
Time to get up close and personal with the financials. Digging out the original budget and the documents with the details on expenses, revenue, and sales are good starting point.
Depending on the company's structure and industry, you should include more in-depth financial figures like EBITDA and COGS.
You should also decide now what time period you’re looking to analyze. Most companies analyze budget variance on monthly, quarterly, and annual cadences.
Work out the variance between the two
Next, calculate the difference between the actual figures and the budgeted cost.
You can do this line-by-line for any item that needs it, like production costs, marketing budgets, or revenue.
Those dollar and percentage variance formulas from earlier should come in handy here.
If you want to save time on the calculations, a software program can help you here.
Determine if it’s favorable or unfavorable
Now it’s time to see if those calculations paint a positive or negative picture.
A positive variance is where the actual cost is less than the budgeted cost or the actual sales are higher than predicted.
A negative (or unfavorable) variance is when the actual costs are higher than what was allocated in the budget, or the sales or revenue target was missed.
Analyze the variances
Now you know what you’re dealing with, it’s time to understand why those variances happened.
Looking at specific transactions or reviewing operational processes might help if it's a monetary issue.
You may also need to consider external factors like market conditions or a new competitor adding pressure to sales.
Take corrective action
Based on the budget variance analysis, business leaders can now devise a plan to save on costs.
A couple of examples are adopting a more aggressive sales strategy to drive revenue or reallocating resources across departments.
Whatever is decided should be noted down and used for the next budget period to avoid future overspending.
Congratulations, you just completed your budget vs. actual variance analysis!
Conclusion: all about budget variance analysis
Now you know all about budget variance analysis.
What it is.
How to do it.
And why it matters.
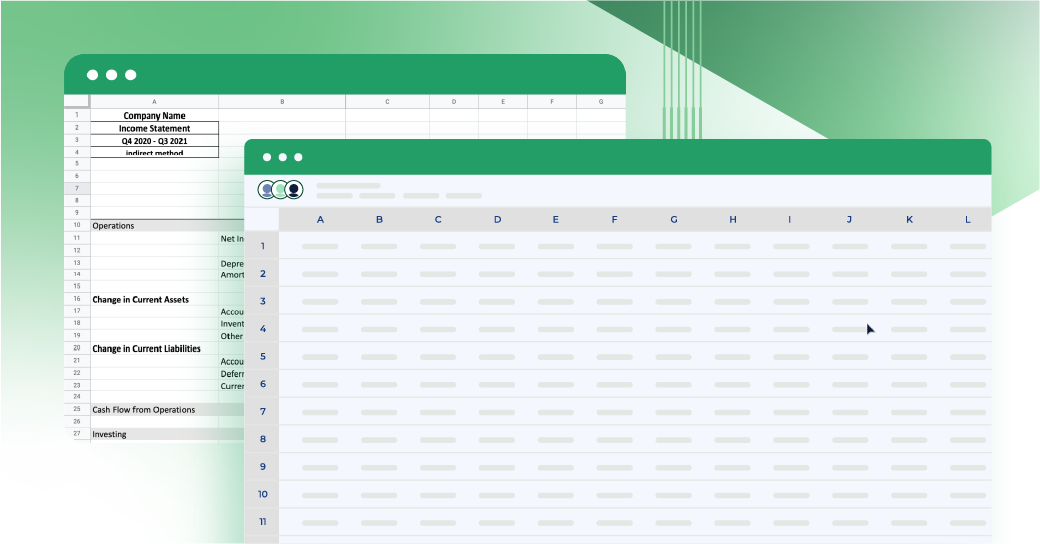
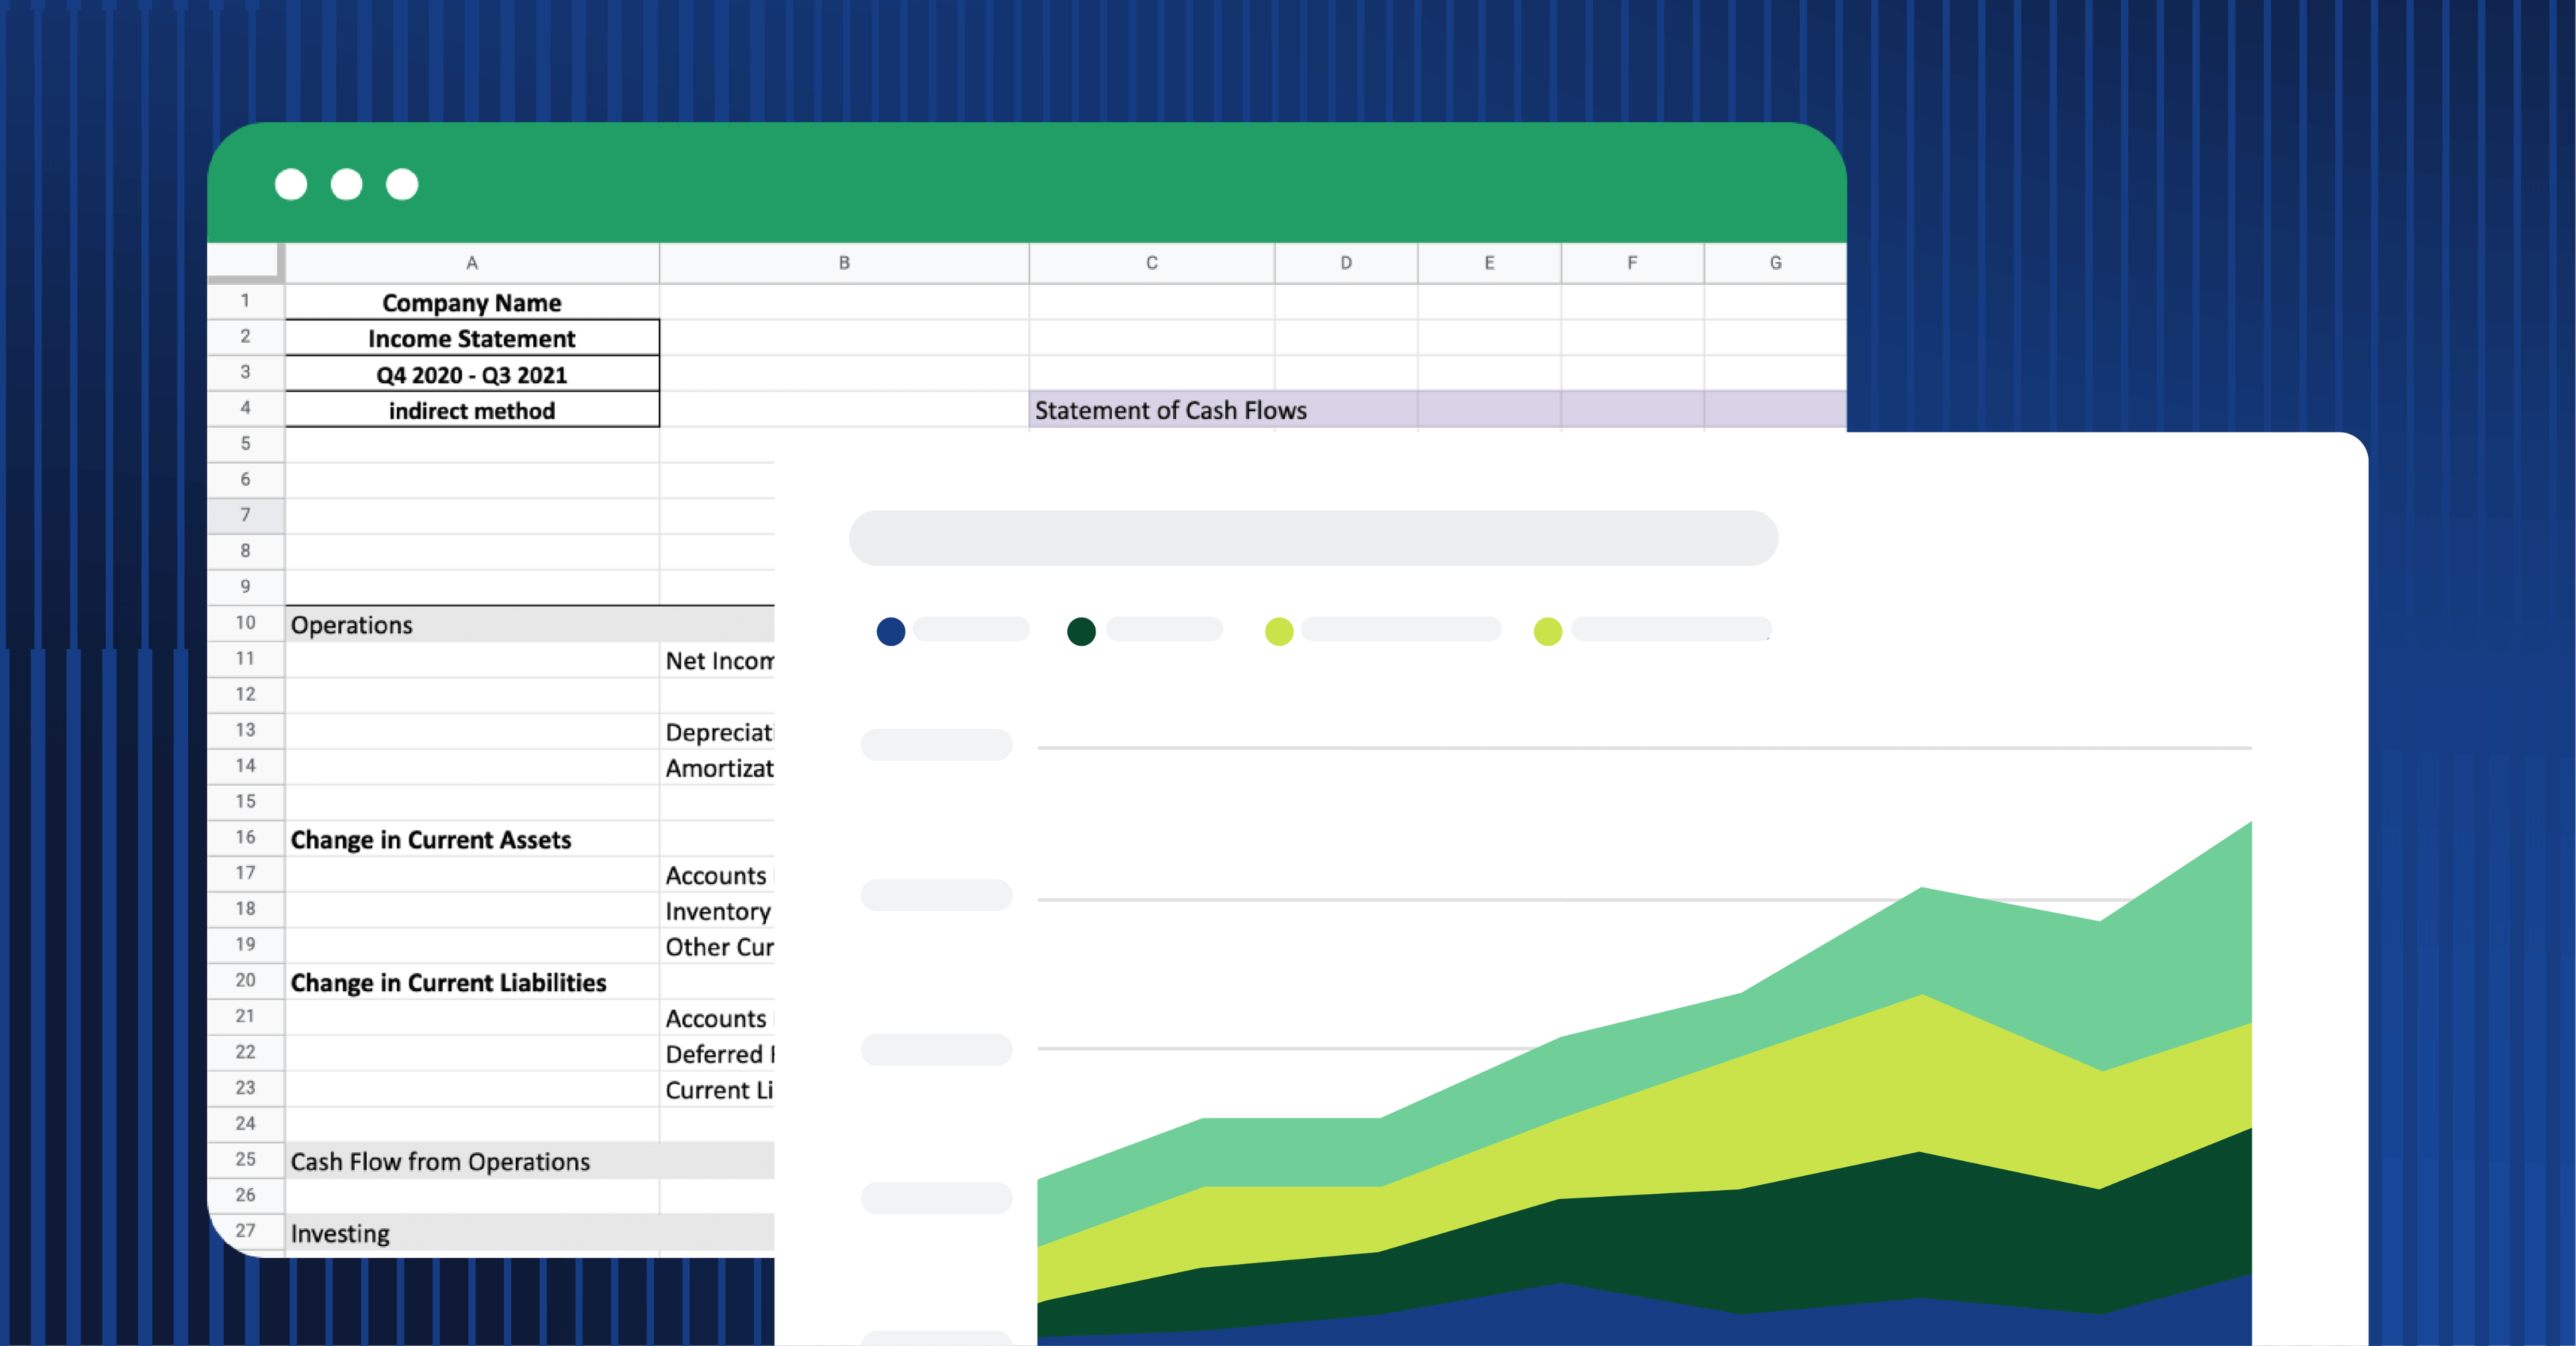
But doing any analysis in Excel has the potential for human error.
And that's where Cube can help.
Cube integrates with your source systems (like your ERP and Salesforce) and Excel, so it's easy to pull data into Excel for your budget variance analysis.
(And you don't have to worry if your numbers or loaded or reconciled. Cube takes care of that for you.)
Sound interesting?
Click the image below to request a free demo of Cube.