Key takeaways
- The chart of accounts is an index of all financial accounts in a company's general ledger (GL).
- There are five major account types in the CoA: assets, liabilities, equity, income, and expenses.
- The leading digit on each account is a reference number indicating what type of account it belongs to.
- It's a best practice to only delete accounts in your CoA at the end of the year.
What is a chart of accounts (CoA)?
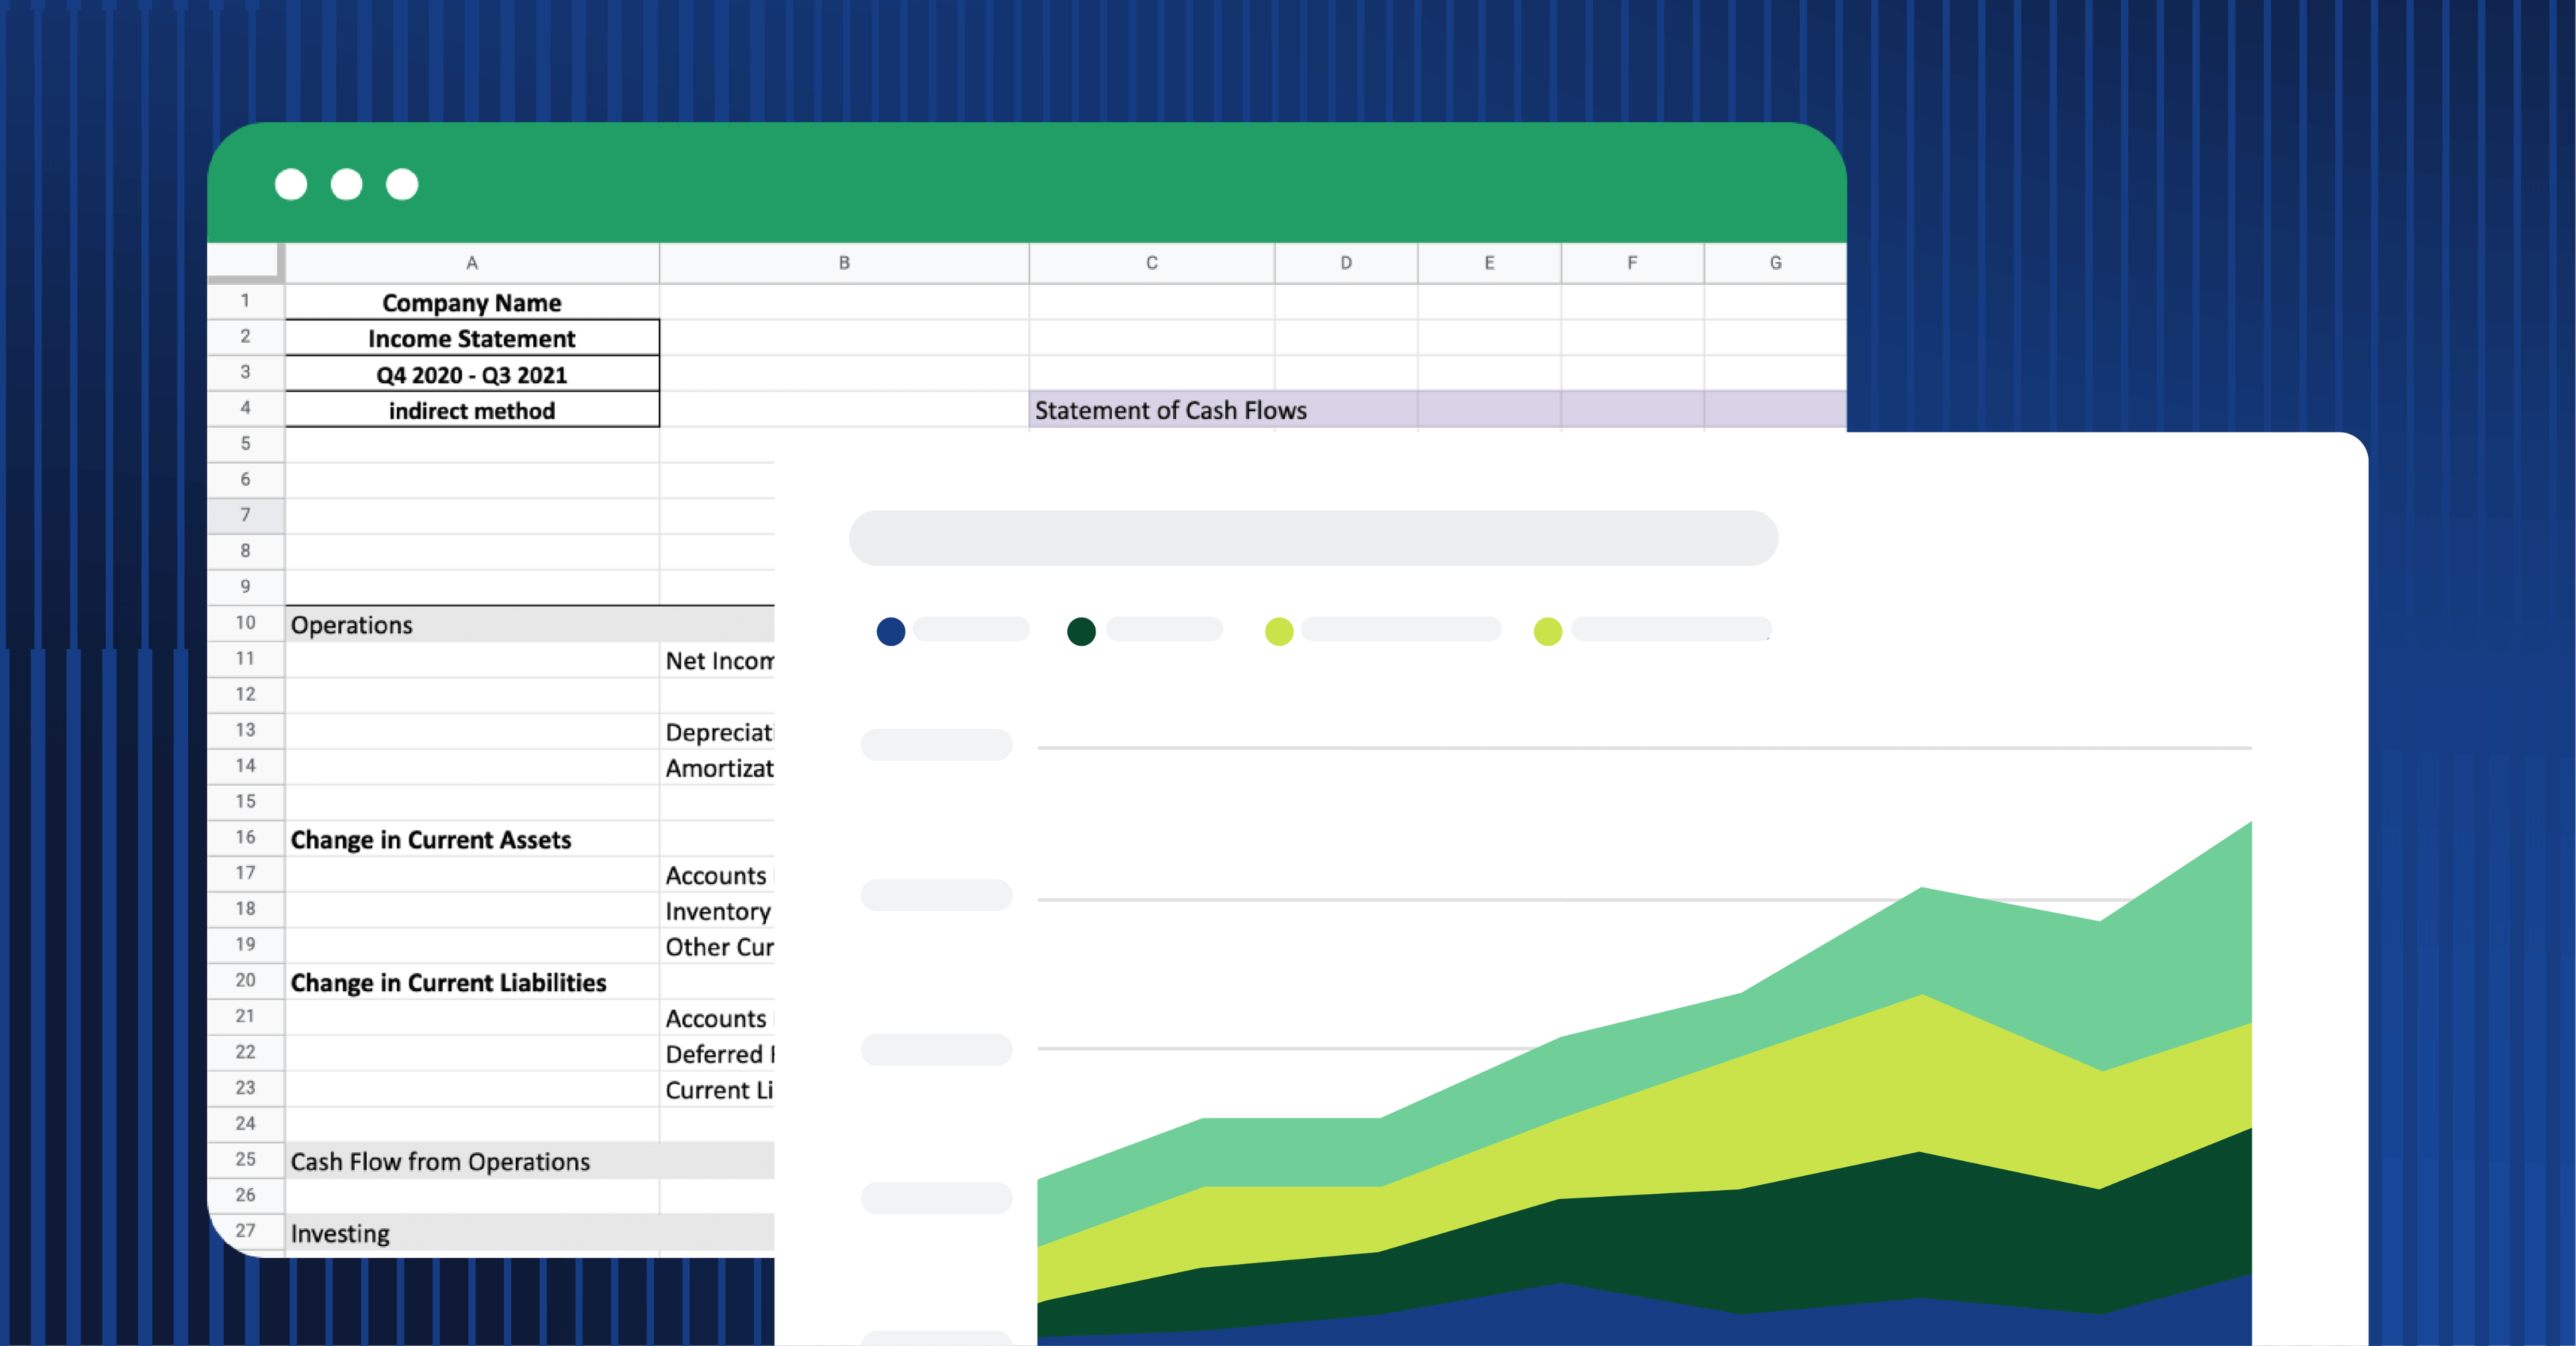
A chart of accounts is an index of all the financial accounts in a company's general ledger. The general ledger is the greater record keeper for a company's financial accounts, with a trial balance validated debit and credit account records.
It segments financial transactions during a specific accounting period into specific account types. The general ledger—and by extension, CoA—tells you where to record each transaction, making lookup and access easy.
CoA replaces outdated paper systems that often led to errors. Research from Intuit shows 40% of small businesses report frequent accounting mistakes when relying on manual processes. A structured chart of accounts brings clarity and gives you a clean view of how money moves through the business.
Chart of accounts structure
It’s not just the content of a CoA that matters. Structure is just as important. A clear, standardized structure makes financial reports easier to read, reduces errors, and simplifies audits.
At its core, the CoA is divided into two main sections: Balance sheet accounts and income statement accounts. Each section is further broken down into specific account types, where the leading digit indicates the account type and subsequent digits provide more specific details. These reference numbers help maintain a standardized structure and facilitate easy identification of accounts.
Common numerical identification scheme
1. Balance sheet accounts
- Assets (Reference number: 1XXX): This category includes accounts that represent what the company owns, such as cash, inventory, and equipment.
- Liabilities (Reference number: 2XXX): These accounts track what the company owes, such as accounts payable and loans.
- Equity (Reference number: 3XXX): Equity accounts reflect the owners' stake in the company, including retained earnings and common stock.
2. Income statement accounts
- Revenue (Reference number: 4XXX): This category tracks income generated from business operations, like sales revenue.
- Expenses (Reference number: 5XXX - 7XXX): Expense accounts capture the costs incurred in the course of running the business, such as payroll, rent, and utilities.
This structure maintains consistency across financial reporting periods, makes it easy to identify and retrieve accounts, allows for scalability, and aligns with accounting standards such as GAAP (Generally Accepted Accounting Principles).
Each account within the CoA should have a clear and concise description to ensure consistent use across the organization. Maintaining this structure consistently over time is crucial for accurate financial comparisons and compliance with accounting standards.
Chart of accounts example
This is a sample chart of accounts for a fictional SaaS company. You can see account descriptions, their account type, and the corresponding statement type.
How a chart of accounts (CoA) works
The CoA follows a principle known as double-entry accounting. Every time you log something in the chart of accounts, you make two entries: a debit from one account and a credit to another.
Here's what this means in practice:
Say you buy a new employee laptop for $800. You'd debit $800 from the appropriate Asset accounts (in this case, Cash) and credit $800 to the appropriate Asset accounts (in this case, Computers). This way the chart of accounts stays balanced, with the sum of the two entries being zero every time.
Five major account types in a chart of accounts are divided into balance sheet accounts and income statement accounts. While CoA can vary depending on the business, it will include assets, liabilities, equity, income/revenue, and expenses.
It's a best practice to list accounts in the order of appearance in financial statements, starting with the balance sheet.
Chart of accounts structure
It’s not just the content of a CoA that’s important—it’s the structure too. A clear and accurate financial report is easy to understand and follow, making errors less likely and auditing more efficient. To make things easy, there is an industry-standard framework you can follow.
At its core, the CoA is divided into two main sections: Balance sheet accounts and income statement accounts. Each section is further broken down into specific account types, where the leading digit indicates the account type and subsequent digits provide more specific details. These reference numbers help maintain a standardized structure and facilitate easy identification of accounts.
Common numerical identification scheme
1. Balance sheet accounts
- Assets (Reference number: 1XXX): This category includes accounts that represent what the company owns, such as cash, inventory, and equipment.
- Liabilities (Reference number: 2XXX): These accounts track what the company owes, such as accounts payable and loans.
- Equity (Reference number: 3XXX): Equity accounts reflect the owners' stake in the company, including retained earnings and common stock.
2. Income statement accounts
- Revenue (Reference number: 4XXX): This category tracks income generated from business operations, like sales revenue.
- Expenses (Reference number: 5XXX - 7XXX): Expense accounts capture the costs incurred in the course of running the business, such as payroll, rent, and utilities.
This structure maintains consistency across financial reporting periods, makes it easy to identify and retrieve accounts, gives room for scalability, sets the stage for easy scalability, and aligns with accounting standards such as the GAAP (Generally Accepted Accounting Principles).
Each account within the CoA should have a clear and concise description to ensure consistent use across the organization. Maintaining this structure consistently over time is crucial for accurate financial comparisons and compliance with accounting standards.
Chart of accounts example
This is a sample chart of accounts for a fictional SaaS company. You can see account descriptions, their account type, and the corresponding statement type.
|
Number |
Account Description |
Account Type |
Statement |
|
1010 |
Cash |
Assets |
Balance Sheet |
|
1020 |
Savings |
Assets |
Balance Sheet |
|
1030 |
Accounts Receivable |
Assets |
Balance Sheet |
|
1080 |
Computers |
Assets |
Balance Sheet |
|
2010 |
Accounts payable |
Liabilities |
Balance Sheet |
|
2011 |
Credit cards |
Liabilities |
Balance Sheet |
|
2014 |
Wages payable |
Liabilities |
Balance Sheet |
|
2020 |
Accrued liabilities |
Liabilities |
Balance Sheet |
|
2050 |
Taxes payable |
Liabilities |
Balance Sheet |
|
2060 |
Notes Payable |
Liabilities |
Balance Sheet |
|
3010 |
Preferred Stock |
Equity |
Balance Sheet |
|
4010 |
Sales |
Income |
Income Statement |
|
5000 |
Advertising Expenses |
Expenses |
Income Statement |
|
5014 |
Wages Expenses |
Expenses |
Income Statement |
|
5050 |
Payroll Tax Expenses |
Expenses |
Income Statement |
Why a chart of accounts is important
The CoA is essential to good bookkeeping and financial management. A standard chart of accounts makes it easy for anyone to step into a business and quickly understand its finances.
A well-designed CoA helps your organization:
- Track expenses and account balances accurately, making it easier to calculate financial ratios and report on overall financial health
- Look up transactions quickly, since it serves as an organized index of money coming in and out of the business
- Record transactions consistently, reducing confusion and minimizing errors
- Support better decision-making, with clear insight into the company’s financial position
- Streamline audits, by providing auditors with a structured and transparent financial framework
- Maintain consistency and control, ensuring standardized reporting across periods and teams
- Scale with growth, allowing you to add accounts and complexity without disrupting reporting
Is a chart of accounts required?
A chart of accounts is not legally required in every jurisdiction, but here’s why you should have one anyway.
Financial organization. A CoA categorizes all financial transactions and helps teams track income, expenses, assets, and liabilities without chaos. Organizations lose an estimated 5% of revenue each year to fraud. This shows how a clear, organized chart of accounts protects financial integrity and reduces risk.
Compliance and reporting. For businesses subject to regulatory standards like GAAP or IFRS (International Financial Reporting Standards), a CoA ensures that financial statements are prepared correctly. It helps in generating accurate reports that comply with legal and industry standards.
Decision-making. A well-maintained CoA allows business leaders to easily access and analyze financial data, enabling informed decision-making. It helps to identify trends, manage budgets, and plan for future growth.
Audit preparedness. If your business is ever audited, having a CoA simplifies the process by providing a clear and organized record of all financial transactions. This can reduce the time and stress involved in an audit, ensuring that your financial practices are transparent and defensible.
How a chart of accounts works
The CoA operates under the principle of double-entry accounting, which ensures accurate reporting across the three primary financial statements: the balance sheet, income statement, and cash flow statement. Every transaction affects at least two accounts, with one debit and one credit, keeping the books balanced.
Here’s how it works in practice:
- Categorization: Every financial transaction is assigned to a specific account within the CoA, such as assets, liabilities, equity, revenue, or expenses.
- Unique code: Each account is assigned a reference number. The leading digit identifies the account type, while the remaining digits provide additional detail, creating a standardized and scalable structure.
- Double-entry principle: Each transaction records equal and opposite entries. For example, if you purchase a laptop for $800, you would debit Equipment (an asset account) and credit Cash (another asset account). This keeps the accounting equation balanced.
- Recording: Transactions are logged in the general ledger under their designated accounts, ensuring consistency across reporting periods.
- Reporting: Because accounts are structured in alignment with financial statements, the CoA feeds directly into the balance sheet, income statement, and cash flow statement. This makes it easier to analyze financial performance and position over time.
It’s a best practice to organize accounts in the same order they appear in financial statements, beginning with the balance sheet. This improves clarity, supports consistency, and makes financial analysis more efficient without restructuring reports later.
Balance sheet accounts
Assets, liabilities, and equities make up the balance sheet. The balance sheet provides insight into the business’s current financial health and whether or not it owes money.
Asset accounts
The assets account lists a company's assets. These include liquid assets like cash, inventory, and equipment, plus prepaid expenses like paid-in-full leases or money that is under contract to come in.
These also include fixed assets like pieces of equipment that the company owns or office supplies like an expensive company printer.
A small corporation might include some arrangement of the following sub-accounts under their assets:
- Cash (main checking account)
- Cash (payroll)
- Cash (main savings account)
- Marketable securities
- Petty cash balance
- Accounts receivable
- Undeposited funds
- Inventory assets
- Prepaid insurance
- Prepaid expenses
- Vehicles
- Buildings
- Equipment
- Computers
Asset reference numbers usually begin with a 1.
Reference numbers are used within a chart of accounts as the leading digit on each account number denotes its type. This code makes it easier to find specific transactions in your chart of accounts.
The reference number for Assets is 1, Liabilities is 2, Equity is 3, Income/Revenue is 4, and Expenses are 5, 6, and 7. We’ll get into a more granular breakdown later.
Liabilities
Liabilities are any debt your company owes. These are the typical sub-accounts you'll see under liabilities:
- Accounts payable
- Company credit card(s)
- Wages payable
- Accrued liabilities
- Taxes payable (including sales tax)
- Notes payable
Liability reference numbers usually begin with 2.
You may have noticed that liability accounts usually have the word "payable" in their name. This is because liability accounts are where you record money that is under contract to leave the business but hasn't yet changed hands.
Because it's the company's obligation to make these payments, these accounts are "payable."
Shareholders equity
Equity is whatever is left after subtracting your company's liabilities from its assets. The simplest chart of accounts will only have three equity accounts listed here:
- Common stock
- Preferred stock
- Retained earnings
Even private companies will have shareholder equity accounts like this if they offer stock options to employees.
Equity accounts usually begin with reference number 3.
Income statement accounts
Expense and income/revenue accounts make up the income statement, which conveys the business’s overall profitability.
Income/Revenu
Revenue is the money your business brings in through sales or investments. As Investopedia notes, “Revenue represents all the income a business earns from its core operations”. Revenue accounts keep track of the money that comes in through normal business operations so you can calculate your net income and operating revenues.
- Investment income
- Sales
- Sales returns and allowances
- Fees earned
Income or revenue account numbers usually begin with reference number 4.
Expenses
Expenses are all the non-debt money you need to spend to keep your business running. In many industries, operating expenses account for 60% to 80% of total revenue, according to data from the United States Census Bureau, making accurate expense tracking essential to protecting profit margins. They are generally categorized into direct and indirect expenses.
Direct expenses are costs that can be directly attributed to the production of goods or services, for example, cost of goods sold (COGS). This covers the direct cost of producing the goods sold by a company, such as raw materials and labor directly involved in production.
Indirect expenses are not directly tied to production but are necessary for the business to operate. Examples include:
- Advertising expenses
- Bank fees
- Depreciation expenses
- Payroll tax expenses
- Rent expenses
- Supplies expenses
- Travel expenses
- Utility expenses
- Wages expenses
- Other expenses
Other expenses that do not fit neatly into these categories are also tracked under expense accounts.
Expense accounts typically begin with reference number 5. It's common for organizations to structure their expense accounts by business function, meaning different company divisions have their own expense accounts.

Chart of accounts best practices
Now let’s review the best practices for managing your chart of accounts.
1. Include clear account descriptions
The chart of accounts should have a short, helpful description next to each account name and account type.
Names like "Accounts Receivable," "Credit Card (Operations)," and "Fees Earned" all have the appropriate level of detail.
These descriptions are important: you want to make it easy to find the appropriate accounts to create whatever financial statement you need for your reporting.
Failure to provide clear and accurate descriptions can lead to confusion, misclassification of transactions, and errors in your financial statements. This not only complicates financial analysis but can also result in non-compliance with accounting standards, potentially leading to regulatory penalties, audits, and a lack of confidence from your investors.
2. Don't delete accounts until the end of the year
It's a best practice to wait until the end of the year—after a close—to merge, rename, or delete accounts. Changing or removing accounts mid-year can add extra complexity during tax season.
For example, if you rename an account mid-year, you may have to track and reconcile transactions across both the old and new account names, increasing the likelihood of errors and making you less confident that all entries are accurately reported. That said, you can always add new accounts if needed.
3. Don't create too many accounts
Your chart of accounts is an index, but it's also meant to be a quick lookup table. You don't need to create a separate account for every transaction, utility, or sale. As AccountingTools notes, “The typical chart of accounts is too large. Having a large chart of accounts leads to issues with incorrect account usage, immaterial account balances, extensive accountant training, higher audit costs, and incorrect financial statements.”
Be smart about lumping similar items together. This keeps you from creating too many specific accounts and spares you from a painful cleanup process at the end of the year.
4. Be consistent
It's best if your CoA doesn't dramatically change year over year. Why? You want to make it easy to compare the performance of different accounts over time. If you're splicing, merging, and deleting accounts, that information can get lost and you'll lose valuable financial data. Or you'll spend too much time reconstructing old accounts, which can lead to mistakes and inaccurate data.
Plus, the GAAP set forth by the FASB (Financial Accounting Standards Board) states regularity and consistency as the first two rules.
5. Consolidate at the end of the year
Take the end of the year as an opportunity to consolidate and simplify your chart of accounts.
Remember: Brevity is elegance. We’re not looking for beautiful designs or elaborate presentations. A shorter chart of accounts is elegant because it avoids unnecessary complexity, allowing users to quickly locate and interpret the necessary information.
You might be worried that a shorter chart of accounts obfuscates important details, but that's unlikely to happen with a good naming system.
6. Understand reference numbers
We told you we’d come back here! Reference numbers are the first digit on each account number that denotes its type. Most financial accounting software will automatically assign numbers for you, so you don't need to worry about creating them yourself. You just need to know the code.
Assets - 1
Liabilities - 2
Equity - 3
Income/Revenue - 4
Expenses - 5, 6, and 7
Here's a more granular breakdown of these different numbers in a standard chart of accounts:
1000 Assets
- 1200 Receivables
- 1300 Inventories
- 1400 Prepaid expenses & other current assets
- 1500 Property plant & equipment
- 1600 Accumulated depreciation & amortization
- 1700 Non-current receivables
- 1800 Intercompany receivables
- 1900 Other non-current assets
2000 Liabilities
- 2100 Payables
- 2200 Accrued compensation & related items
- 2300 Other accrued expenses
- 2500 Accrued taxes
- 2600 Deferred taxes
- 2700 Long-term debt
- 2800 Intercompany payables
- 2900 Other non-current liabilities
3000 Owner equities
4000 Revenue
5000 Cost of Goods Sold
6000-7000 Operating Expenses
7. Follow FASB and GAAP chart of account guidelines
The FASB (Financial Accounting Standards Board) is an independent nonprofit organization responsible for establishing accounting and financial reporting standards for companies and nonprofit organizations in the United States. It has the authority to establish and interpret GAAP (Generally Accepted Accounting Principles) for all of these entities.
Public companies in the U.S. must follow GAAP when their accountants compile their financial statements to keep their financial reporting consistent, transparent, and comparable for investors and regulators.
8. Use accounting software
There are several software solutions that can help automate and manage the chart of accounts. According to Sage, finance teams can save up to 30% of their time by automating manual accounting tasks, highlighting the efficiency gains software provides over manual systems.
While Excel and Google Sheets are great for beginning businesses, you’ll most likely want a dedicated financial software platform for all of your accounting needs. The best software offers advanced features like automation, integration, and enhanced security, which are essential as your business grows and your financial processes become more complex.
Best chart of accounts software
Accounting solutions handle your CoA for you, which makes it super simple and easy to set up. Here are some of our recommendations:
1. NetSuite

NetSuite is a cloud-based enterprise resource planning (ERP) platform that combines financial management, CRM, eCommerce, and operational tools within a single system. It is commonly used by mid-sized to large organizations that require integrated processes across finance, sales, inventory, and multi-entity operations. The platform supports consolidated reporting, multi-currency management, and cross-functional visibility. NetSuite integrates with FP&A platforms such as Cube to extend planning and analysis capabilities.
Additional features:
- Financial management: Supports general ledger management, financial close processes, consolidated reporting, and multi-entity oversight within a centralized ERP environment
- Inventory management: Tracks inventory levels, item valuation, procurement activity, and fullfillment workflows across locations
- Accounts receivable: Manages customer invoicing, collections, credit tracking, and revenue recording tied to the general ledger
- Accounts payable: Handles vendor bills, approval workflows, payment scheduling, and liability tracking
Pricing: Pricing is not listed on its website.
2. Xero
.png?width=150&name=xero-logo%20(1).png)
Xero is a cloud-based accounting platform designed for small to mid-sized businesses. It supports core bookkeeping functions, including invoicing, expense tracking, bank reconciliation, and financial reporting within a web-based interface. The platform enables real-time collaboration between business owners and advisors and provides visibility into financial performance via built-in reporting and project-tracking tools. Xero is commonly used as a primary accounting system for organizations that require accessible, cloud-native financial management without enterprise-level ERP complexity.
Additional features:
- Bill payments: Manages vendor bills, approval workflows, and scheduled payments
- Expense management: Tracks employee expenses, receipts, and reimbursements
- Bank connections: Syncs directly with financial institutions for automated transaction reconciliation
- Project tracking: Monitors project costs, time, and profitability by job or client
- Analytics and dashboards: Provides financial summaries and performance insights
Pricing:
- Early: $25/month
- Growing: $55/month
- Established: $90/month
3. QuickBooks
![]()
QuickBooks is an accounting and ERP platform developed by Intuit. It is used by small and mid-sized businesses for bookkeeping, financial reporting, payroll, and operational finance management. The platform supports transaction recording, general ledger management, invoicing, and financial statement generation within a cloud-based system.
QuickBooks integrates with FP&A platforms such as Cube, allowing financial data to sync into Excel or Google Sheets for planning, reporting, and analysis workflows. It is commonly used as a system of record for financial transactions while external tools support modeling and strategic finance processes.
Additional Features:
- Core accounting and ledger management: Maintains the chart of accounts, records transactions, and generates financial statements
- Billing and revenue management: Creates invoices, tracks customer payments, and monitors revenue activity
- Cash flow monitoring: Provides visibility into cash inflows and outflows through built-in reporting tools
- Accounts payable management: Tracks vendor bills, schedules payments, and manages outstanding obligations
- Payroll processing: Calculates wages, taxes, and deductions with integrated payroll functionality
- Commerce integrations: Syncs sales data from connected online platforms into accounting records
Pricing:
- Simple Start: $38/month
- Essentials: $75/month
- Plus: $115/month
- Advanced: $275/month
4. Sage Intacct
![]()
Sage Intacct is a cloud-based ERP and financial management platform designed for mid-sized to enterprise organizations. It supports core accounting, multi-entity management, and advanced financial reporting within a centralized system. The platform is commonly used by organizations that require structured controls, dimensional reporting, and scalability across business units. Sage Intacct connects with FP&A platforms such as Cube to extend reporting and planning beyond core accounting.
Additional Features:
- Project accounting: Track projectc osts, revenue allocation, and overall profitability
- Accounts payable: Manages vendor invoices, approvals, and payment processing
- Accounts receivable: Handles customer billing, collections, and payment tracking
- Order management: Oversees sales order processing and fulfillmet workflows
- Inventory management: Monitors inventory levels, valuation, and stock movement
- Cash management: Supports cash tracking, reconciliations, and liquidity oversight
- Cloud planning and budgeting: Enables budget creation, forecasting, and financial planning within the cloud platform
Pricing: Pricing is not listed on ites website.
5. Google Sheets
![]()
Google Sheets is a cloud-based spreadsheet application used for data organization, analysis, and collaboration. It is widely adopted across business functions, including finance, due to its accessibility and real-time collaboration capabilities. The platform runs in a web browser and supports shared editing, version history, and integrations with other cloud-based tools. While many finance teams rely on Excel for advanced modeling, Google Sheets is often used for collaborative planning, lightweight analysis, and cross-functional reporting.
Excel, Google Sheets makes numbers more accessible, easier to understand, and transparent.
Additional features:
- Real-time editing: Allows multiple users to work in the same spreadsheet simultaneously with instant updates
- File sharing and access controls: Enables easy sharing via link or email with customizable permission levels
- Comments and collaboration tools: Supports in-sheet commenting, tagging, and threaded discussions for team communication
- Smart fill: Automatically detects patterns in data and suggests completions to reduce manual entry
Pricing:
Google Workplace requires a 1-year commitment, with the following prices per user.
- Personal: Free
- Starter: $9.20/month
- Standard: $18.40/month
- Plus: $28.70/month
- Enterprise: Upon request
6. Excel
![]()
Excel is a spreadsheet application widely used for financial modeling, reporting, and data analysis. It supports advanced formulas, pivot tables, data visualization, and custom financial models, making it a core tool for FP&A and strategic finance teams. Excel remains commonly used for budgeting, forecasting, variance analysis, and scenario modeling due to its flexibility and familiarity. Platforms such as Cube extend Excel by connecting live data from source systems, enabling governed, real-time reporting and planning workflows without replacing existing spreadsheet models.
Additional features:
- Desktop, web, and mobile access: Provides cross-device functionality through locally installed and cloud-based versions
- Real-time collaboration: Supports shared workbooks and simultaneous editing through Microsoft 365
- Image recognition and data capture: Converts tables and printed data into editable spreadsheet format
- Power BI connectivity: Connects to Power BI for advanced visualization and business intelligence reporting
- Integrations: Integrates with ERP systems, databases, and third-party tools for automated data imports and workflow extensions
Pricing:
- Business Basic: $7.20/user/month
- Business Standard: $15.00/user/month
- Business Premium: $26.40/user/month
7. FreshBooks
![]()
FreshBooks is a cloud-based accounting platform designed primarily for small businesses, freelancers, and service-based organizations. It supports invoicing, expense tracking, time tracking, and basic financial reporting within a web-based interface. The platform is commonly used by businesses that prioritize billing, client management, and simplified bookkeeping workflows over complex ERP functionality.
Additional features:
- Core accounting: Records transactions, manages the general ledger, and generates standard financial reports
- Payroll processing: Supports employee compensation, tax calculations, and payroll compliance through integrated services
- Invoicing and billing: Creates customized invoices, tracks payment status, and automates reminders
- Estimates and proposals: Generates project estimates that can be converted into invoices upon approval
Pricing:
- Lite: $23/month
- Plus: $43/month
- Premium: $70/month
- Select: Custom pricing
8. SAP Business One
![]()
SAP Business One is an enterprise resource planning (ERP) solution designed for small to mid-sized businesses. It integrates accounting, sales, inventory, and operational processes within a single system to support centralized management and reporting. The platform provides real-time visibility into financial and operational data, enabling organizations to manage core business functions across departments.
Additional features:
- Core accounting: Manages general ledger, accounts payable and receivable, and financial transactions
- Banking and reconciliation: Supports bank integrations, reconciliations, and cash management processes
- Financial reporting and analysis: Generates standard financial statements and performance reports
- Warehouse and accounting integration: Connects inventory management with financial records for accurate valuation and reporting
Pricing: Pricing isn't listed on its website.
9. Cube
![]()
Cube is the financial intelligence platform built for the AI-era. Cube complements your accounting system; it doesn’t replace it. While ERPs like QuickBooks, NetSuite, Sage Intacct, and Xero serve as systems of record for transactions, Cube sits on top as the intelligence layer that transforms that data into structured reporting, planning, and analysis. Teams reduce reporting time by up to 82% when they use Cube, accelerating month-end close and improving reporting efficiency.
Cube automatically pulls data from your ERP, CRM, HRIS, and other source systems to create a clean, governed chart of accounts that stays consistent across reporting periods. Instead of manually exporting trial balances or rebuilding P&Ls every month, finance teams can sync actuals directly into Excel or Google Sheets, maintain structured account hierarchies, and ensure every report ties back to a single source of truth.
Additional features:
- Conversational AI in Slack and Teams: Ask Cube questions in plain English and get fast, AI-powered answers without leaving your workflow
- Smart access and permissions: Set user and role-based controls to keep teams focused and data secure while maintaining smooth collaboration
- Multi-scenario analysis: Model and compare different scenarios based on changes to pricing, demand, or cost assumptions to understand business impact
- Forecasting powered by AI: Generates forecasts based on past and current financial data to support better decision-making
- Financial Intelligence: Provides finance teams with faster answers, deeper insights, and clearer whys
Pricing: Cube offers custom pricing and plans starting at $30,000 annually.
The bottom line on a chart of accounts
According to a recent financial reporting statistics report, only 18% of finance teams complete their month‑end close in three days or less, and half still take longer than five business days. This is why structured financial practices like a well‑designed chart of accounts support faster, more accurate reporting and clearer business insight.
Now you know all about how to create a chart of accounts and why it’s so important to the smooth running of your business
To learn more about financial best practices and how tools like Cube can optimize your processes, schedule a free demo with Cube.