Evaluating financial performance in the mid-year
FP&A is all about transforming your business into a well-oiled machine. Sales forecasts, budget variance analysis, and cash flow projections come together to ensure each dollar is used in the most effective way possible.
But every now and then, it's necessary to reflect on your business's financial performance.
Are you hitting revenue targets? Could operational areas be streamlined? Answering questions like these is one goal of a mid-year performance review. If weak points are identified, the other goal will be course correction. This could take a few different forms: creating more realistic objectives, adjusting strategies, or reallocating resources.
With a mid-year performance review, you're assessing your company's financial health, then taking action.
Fortunately, companies have "built-in" financial health metrics in the form of three financial statements: the balance sheet, the income statement, and the cash flow statement. Any investigation should begin with these.

The three financial statements
The three financial statements—income sheet, balance sheet, and statement of cash flows—provide granular financial forecasts that explain the future of your company's financial performance. Let's take a closer look at each.
Balance sheet
The balance sheet shows a company's assets, liabilities, and equity. Think of it as a snapshot of your company's financial position.
The balance sheet clarifies whether assets and liabilities are current (short-term) or non-current (long-term). The goal is to show how much cash is left if the business sold all assets and paid all debts. You want to keep these fairly balanced (no pun intended) so you're never in danger of running out of liquidity.
Income statement
The income statement shows your company's revenue and expenses over a specific period. When you add these up, you'll either have a net profit or a net loss—that's why it’s also known as the "profit and loss" statement. This ability to see if earnings were trending upward or downward during a certain period provides a clearer picture of a company's financial health.
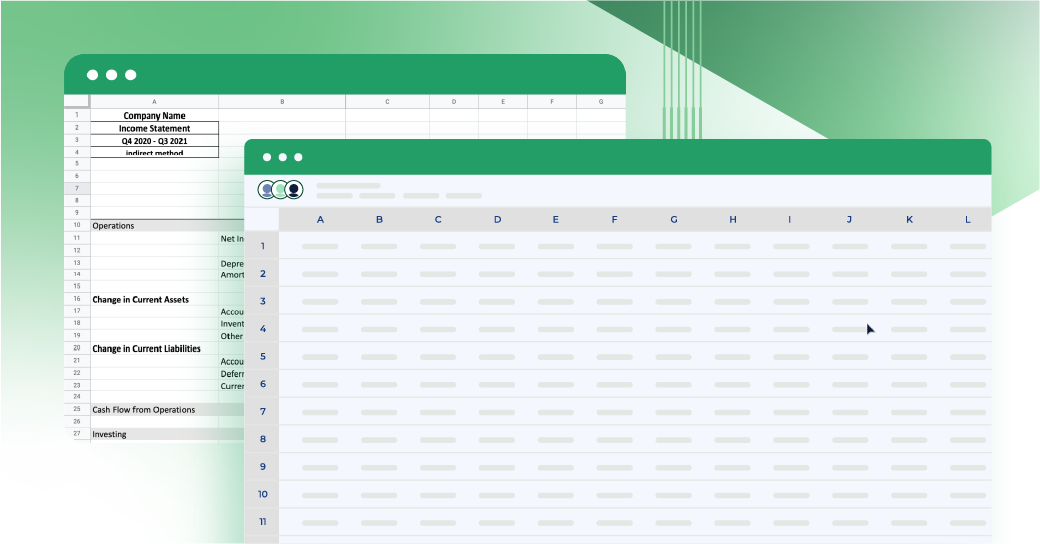
Cash flow statement
The cash flow statement is concerned with your most liquid asset: cash. It shows where it came from and where it went over a specific period.
The cash flow statement makes it easy to track cash flows by dividing transactions into three types: operating cash flows, investing cash flows, and cash flows from financing activities.
Looking at the numbers on financial statements can be helpful if you want to hone in on a specific aspect of your business, say current assets (balance sheet) or cost of goods sold (income statement). But it's really when you see how all these metrics work together—often across financial statements—that you get a clear picture of financial health.
That's where financial ratios come into the picture.
Ratios for financial performance analysis
Let's start with the most common: the current ratio, a measure of liquidity (your ability to pay bills and service debt).
The current ratio formula is:
Current Assets / Current Liabilities
A stricter version is the quick ratio. Also known as the acid test, it's stricter because it only considers assets that can be liquidated within 90 days (as opposed to the current ratio’s 12 months). As such, it excludes inventory and prepaid assets.
Whether you use the current or quick ratio, you'll want a result higher than 1. This means you're not in danger of being unable to pay debts within 12 months (current ratio) or 90 days (quick ratio).
At the same time, a result much higher than 1 (i.e., 2.5 or greater) shows you're not using your money. You’re experiencing opportunity cost. It would be better to invest that money, whether in an interest-bearing account or company expansion.
Inventory turnover ratio
Your inventory turnover ratio tells you how quickly you're selling your complete inventory. A high result means you're managing inventory efficiently (i.e., you have low holding and capital costs).
The inventory turnover ratio is:
Cost of Goods Sold / Average Inventory
You'll find average inventory on the balance sheet.
Aiming for a result between 5 and 10 is a good general rule. This means you're turning over inventory within 1-2 months. However, an ideal turnover rate depends on your sector—you should compare to companies in the same industry.
A poor inventory turnover ratio could mean a few things. You may need to:
- Change your marketing strategy
- Introduce new products
- Reduce your average inventory amount
- Discount strategically
Debt-to-equity ratio
The debt-to-equity ratio looks at company debt compared to shareholders' equity. It’s a measure of solvency—the company's ability to meet long-term (not only short-term) debts.
Here, we use the term leverage. A high debt-to-equity ratio can signify you're relying too heavily on financing (i.e., you're over-leveraged). This can indicate you might not be able to pay your debts.
However, you also don't want it to be too low, as this can show you're not financing to your potential.
The debt-to-equity ratio is:
Total Liabilities / Shareholders' Equity
A result between 1 and 2 is ideal.
Accounts receivable turnover ratio
Your accounts receivable turnover ratio shows how quickly you collect on customer invoices.
The formula to calculate it is:
Net Credit Sales / Average Accounts Receivable
The higher, the better—a faster collection process means more cash on hand. If your turnover is too slow, you'll want to simplify the payment process or look into offering alternative payment methods. You’ll also want to look at your credit policies or offer early payment discounts.
Tracking revenue
At the beginning of the year, you probably set a target for revenue growth. The mid-year performance review is the perfect time to measure financial performance and see if you're hitting that target.
To track revenue growth, subtract your current revenue from the previous period's revenue, then divide the result by the previous period's revenue.
What if you're not meeting your targets? It's time to look at your sales funnel. Where is the issue? Maybe your marketing’s telling dad jokes when it needs to be telling… well, better jokes. If it's your sales team, you might need better incentives. Talk to them, and get ground-level insights on the situation.
Of course, any measures of revenue need to be put in the context of profitability.
Evaluating profitability
Profitability is one of your most important financial performance indicators, divided into two types: gross profit and net profit.
Gross profit
Gross profit shows how much you're earning after costs of goods sold. You can view it as a way to see what you're earning per unit sold.
Your gross profit margin helps you understand the effectiveness of your core business operations. It can help guide pricing decisions and let you know if you need to explore ways to reduce the cost of raw materials or labor.
Net profit
Net profit or net income looks at how much you have left over after all expenses, not just costs of goods sold. It's the bottom line, literally (on your income statement).
A low net profit margin (without a low gross profit margin) would tell you you're spending too much on operations, or perhaps have too much debt. You'll need to think about ways to reduce costs, such as lowering personnel expenses, travel, marketing, rent, etc.
Return on equity (ROE)
A final measure of profitability is return on equity. ROE looks at how effectively the money the company owns (shareholder's equity) is transformed into net earnings. The higher, the better.
A low ROE can indicate you're over-leveraged, or you may not be generating enough profit to cover your debt expenses.
Calculate ROE by dividing net income by total shareholder's equity.
Finally, for all the above metrics, don't forget to benchmark by comparing results to other companies in the same industry.
Working capital and cash flow
While cash flow and working capital are related, they're not the same. Cash flow is the amount of money that's coming into and going out of your business. Working capital is what you have available to fund day-to-day operations—the difference between your current assets and your current liabilities.
Cash flow is divided into two types: operating cash flow and free cash flow. Free cash flow is the one you want to look at. A low free cash flow will tell you you're not retaining enough from operations or are spending too much on capital expenditures.
Many of the other metrics play into free cash flow. To boost it, you can boost revenue, decrease expenses, and manage inventory more efficiently.
It's important to keep a measure of both working capital and cash flow. Together, they'll tell you how much money you have to finance new projects and when you should execute them.
Gathering data for your mid-year review
The ratios above depend on the information in your financial statements. As neat as it would be, financial statements don't populate themselves—your team will have to gather the data and perform the calculations. There's plenty of room for error, and flawed data means flawed decision-making.
Obviously, the course corrections agreed upon in your mid-year performance review will only be helpful if they're based on accurate data. The best way to ensure data is accurate? Software.
With FP&A software, data is automatically recorded as soon as it's generated. It's guaranteed to be error-free, and you don't have to wait to incorporate it into your planning.
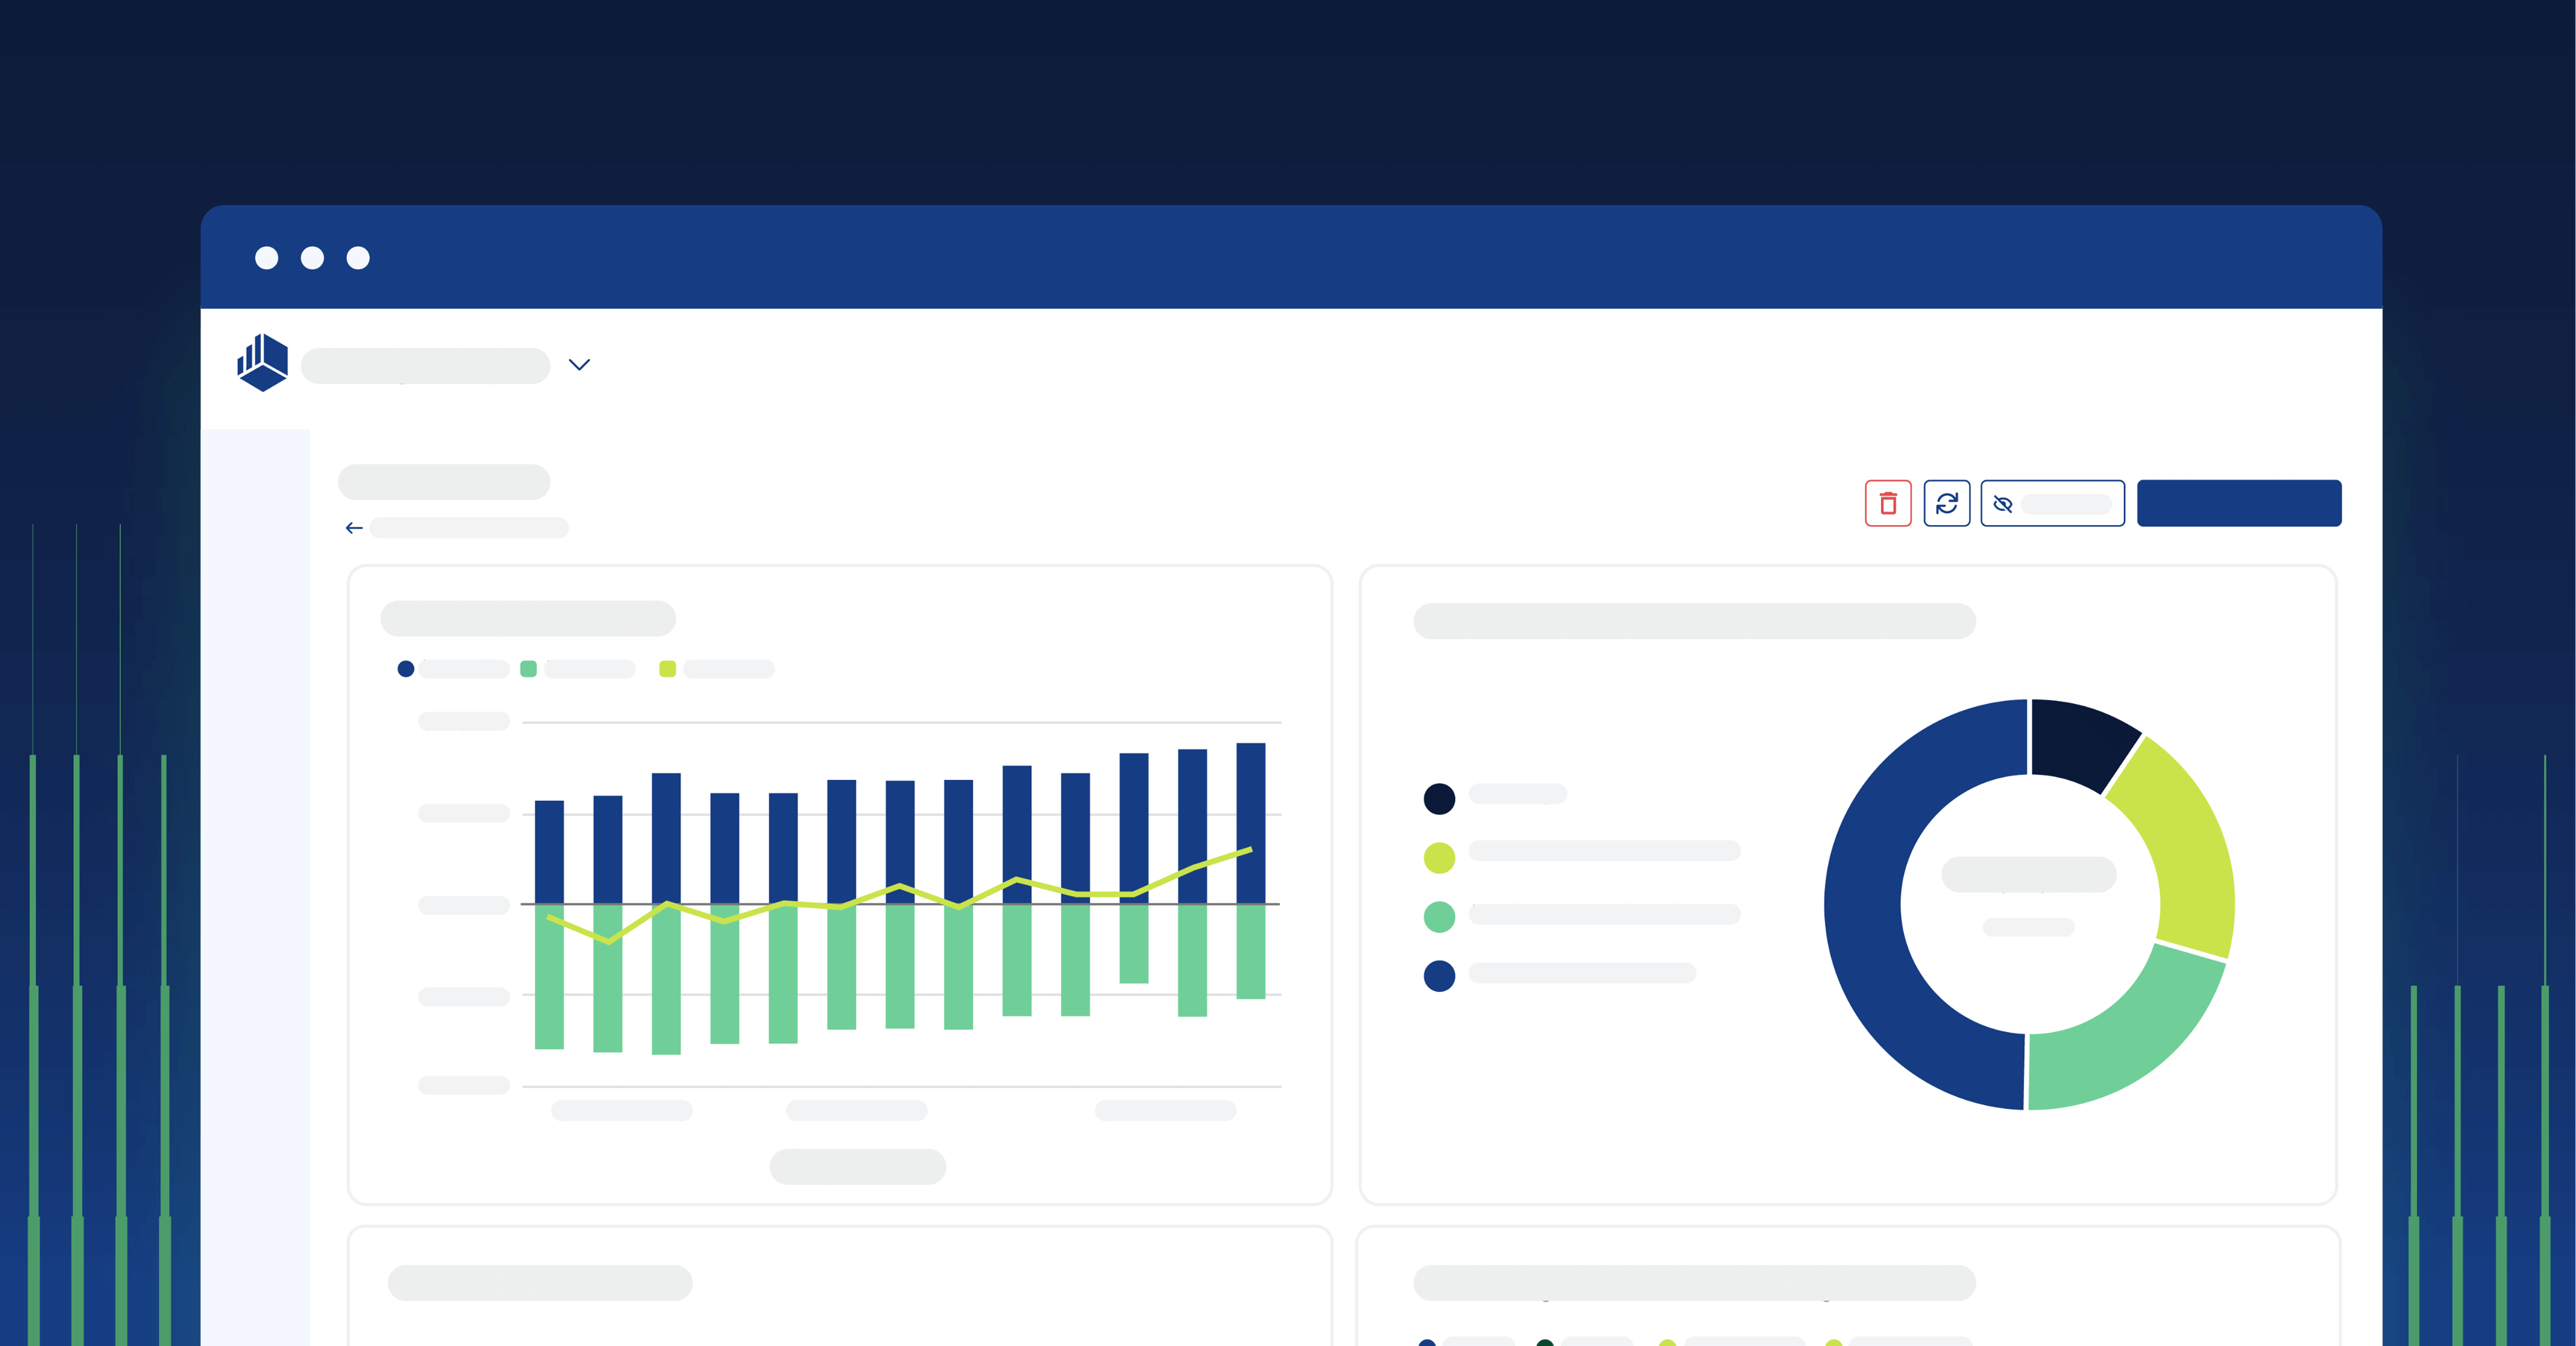
Software also helps you identify trends in historical data and visualize them with interactive dashboards. Analyzing trends and metrics allows you to understand how different variables affect one another. For example, you could use the software to track the correlation between marketing spend and sales.
All this helps base your mid-year performance review on a solid foundation. But there's another critical piece for making adjustments on the fly: rolling forecasts.
Rolling forecasts
When we think of financial forecasts, we usually think of "one-and-done" forecasts. You make the forecast, then that's it—it's static.
While these can be helpful, they can also be misleading. What if the situation changes? Assumptions you made in December may no longer ring true in June. Is it really ideal to base your budget on how things went the year before?
Rolling forecasts say no. As opposed to "one-and-done" forecasts, rolling forecasts add new information to your historical data and your YTD performance.
Since changes can be made as the business environment changes, rolling forecasts can be much more useful than traditional forecasts. You might compare a traditional forecast to predicting the weather a month out, then not changing your predictions as the date gets closer and conditions change. Not the best idea!
Key to rolling forecasts is re-forecasting, which involves modifying your forecasts with actuals. That sounds like it could be a hassle—but with automated software, it's not necessary to update it manually, as new data is added automatically.
Rolling forecasts should absolutely be included in mid-year performance reviews. They help you make more accurate changes and give you a chance to reset your budgets before the following year.
Build your presentation
Now that you have the pieces in place, you can get to the main event: the mid-year performance review.
First, a mid-year performance review must involve all department heads. Not only to get the most complete view of the company's situation (the head of the sales department may have unique insights on revenue fluctuations, for example) but also to communicate new strategies that ensure alignment with objectives.
The first step of your mid-year performance review should be to determine what areas need course correction using the ratios above. The second should be to communicate that to stakeholders and decision-makers.
A complete FP&A solution not only helps you gather/analyze data but also present it. With interactive dashboards, customized reporting, and powerful data visualization, you can make complex financial metrics easy to understand. You can clearly indicate the connection between, say product cost and low gross profit, or marketing efforts and inventory turnover. Why is a specific metric of financial performance important?
From there, devise solutions as part of a collaborative process.
Make adjustments
Mid-year performance reviews aren't just for course correction. They're also for making adjustments to your budgets and forecasts and fortifying your business against risk.
Do you have any obvious budget or forecast variances? Pinpoint the causes by breaking it down. For example, if you're looking at a sales variance, examine price and volume. Have external or internal factors changed?
Whatever the cause, you can make adjustments to your rolling forecasts so resources are optimally allocated. You can't do that with a static forecast!
To safeguard financial health, integrate scenario planning. Scenario plans help you prepare for major changes without risking other parts of your business. Rolling forecasts can actually help a lot here, as it makes sense for scenario plans to incorporate ongoing trends and data.
Set goals
A thorough financial analysis would be useless without establishing some kind of corrective action—the final step in this process.
Set realistic targets that can be tracked over time. Since they're based on historical data and are ongoing, rolling forecasts help in both regards. For example, during your mid-year review, you recognize marketing expenses have exceeded the budget without a corresponding increase in sales. You decide to tweak your marketing strategy. By using rolling forecasts, you can monitor the impact of these changes in real time.
In your next mid-year performance review, you'll repeat the process. With the right tools, however, you'll be much more likely to (like Luke Skywalker) “stay on target” rather than having to create new goals. You can then expand on what you have and boost your financial health.
Conclusion: get your head in the game
And there you have it, the whistle has blown on our half-time financial review. Just as a coach analyzes the game and motivates the team, this mid-year check gives you the insights and inspiration needed to face the rest of the year with confidence. Keep these strategies in mind, and you'll be better positioned to navigate the challenges and opportunities that lie ahead.
Want to learn how Cube can help you lead your team to victory? Request a free demo today.