Understanding horizontal analysis
Most financial metrics look at the current data in isolation. This can be useful if you’re comparing the numbers with industry averages or rules of thumb, but horizontal analysis is a far better way to gauge the success (or lack) of the strategic decisions being made in the company.
Horizontal analysis is simply looking at how company performance has changed over multiple periods. For example, a gross profit margin of 15% might seem okay, but there’s no context for that number. But if you compare that to the previous two years in which it was 12% and then 14.2%, it’s suddenly clear that this is a positive result for the company as it shows steady improvement over time.
A common consideration is horizontal vs vertical analysis. Vertical analysis looks at the data for just the current year, horizontal analysis compares this data over multiple periods.
The horizontal analysis formula is:
Horizontal analysis % = (Amount in comparison period - Amount in base period) / Amount in base year x 100

The strategic significance of horizontal analysis
For FP&A leaders, this form of analysis is one of the most important types that they conduct. After all, financial planning and analysis is all about trends. It’s about aiming to sustain positive trends and alter negative ones, to project the best financial outcome possible and then implement strategies to make it a reality.
The benefits of horizontal analysis include the ability to help to set scenarios, manage risk, and evaluate performance.
Say that revenue has been growing at a steady pace of 3% per year over the past decade. FP&A leaders can create projections based on 3% as a base case scenario, and then set 1% as a poor case scenario and 4.5% as a growth case scenario. Because of the horizontal analysis that’s been conducted, these figures can be chosen with a reasonable level of certainty.
Looking back at this historical trend can also help with mitigating risks. Performance from difficult periods (such as the 2008 financial crisis or the COVID-19 pandemic) can be used to identify financial statement trends at the time and project what the impact would be if similar events were to occur again.
With a clear trend expectation, it’s simple to evaluate how closely the company has managed to match the projections and ensure strategic alignment going forward.
Conducting horizontal analysis: a step-by-step approach
Horizontal analysis really is quite simple, and it can be conducted using any metric within your company. Here’s a step-by-step guide on how to do it.
Step 1 - Gather data
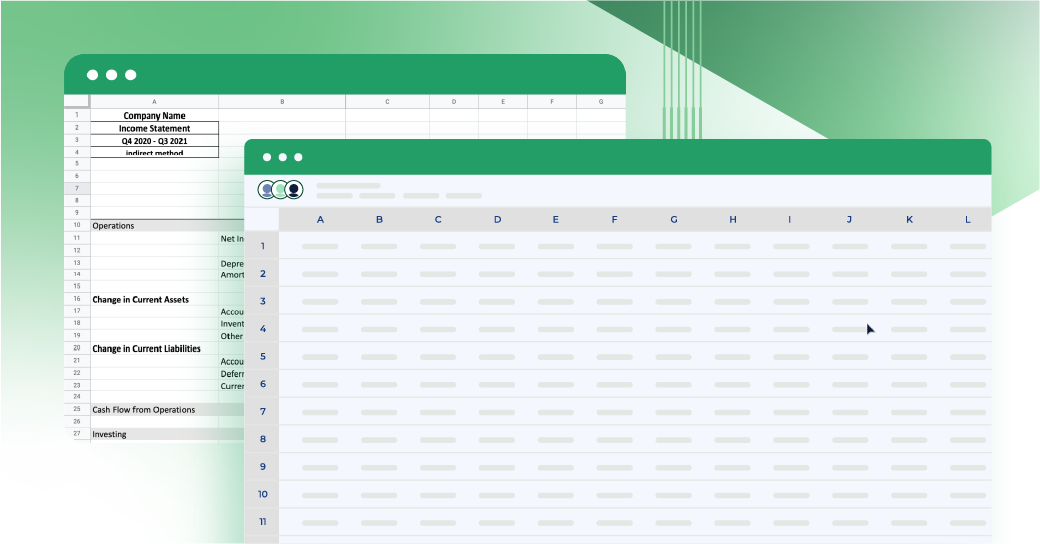
If you want to conduct trend analysis on gross profit or revenue, you’ll want to conduct horizontal analysis of income statements; or, if it’s assets or liabilities, you’ll want the balance sheet. You can also review non-financial data too, like user numbers.
Either way, you first need to gather the relevant data for the years you want to analyze.
Step 2 - Calculate nominal changes
Next, you’ll want to extract the amounts by which these figures have changed through each period. Using spreadsheets is an easy way to do this, so you can quickly see the dollar value that the metric has increased or decreased by each period.
Step 3 - Calculate percentage changes
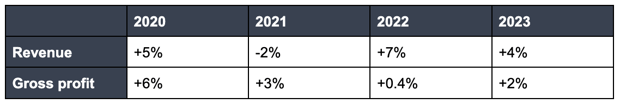
Next, you need to use these nominal figures to calculate the percentage change over the previous period. As mentioned earlier, this will give you a series of numbers that show the percentage increase or decrease over time. The end result will look something like this:
Step 4 - Interpret the results
As you can see, the trend in this example is very positive. Even though revenue was down in 2021, horizontal analysis allows us to see that over time, the overall trend is up. It also shows us that while gross profits are also trending up, that growth appears to be slowing and not keeping pace with revenue growth. This could be a clue for FP&A teams to look closer at how the company is maintaining profitability as it grows.
Real-world applications of horizontal analysis
Horizontal analysis is arguably the most widely used type of financial analysis there is. We need context to make decisions on what changes we should make.
A senior executive at a company can’t make any decisions based on a top-line revenue figure alone. Is that figure higher than last year, or lower? What has the trend been with expenses over that time? Horizontal analysis brings context to the numbers from their previous periods, but also with other metrics.
Here’s another example to show horizontal analysis in action. Big Jim’s Tires wants to conduct a comparative analysis of the financial results from the last two calendar years.
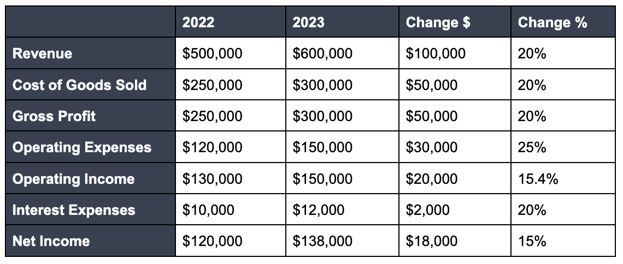
We can see that revenue and cost of goods have grown proportionally, meaning Big Jim is able to maintain a consistent profit margin. While expenses went up as well, overall net income has increased, which shows solid financial performance.
The horizontal analysis also highlights areas to take a closer look at. Here, the 20% jump in interest expenses would be worth evaluating (although it is still a relatively small amount overall).
Integrating technology in horizontal analysis
As with any form of financial analysis, technology can help save you time, making the process of horizontal analysis faster and easier.
FP&A software (like Cube) stands out as a practical choice for those looking to simplify their horizontal analysis. It's designed to fit right into your existing processes, making it super user-friendly. What's great about this software is how it automates the tedious parts of gathering and analyzing financial data. This means financial leaders can quickly get their hands on the insights they need, without getting bogged down in manual work.
Plus, it's not just about speed; it's also about getting smarter with your data. FP&A software helps you see the trends and changes in your finances over time, offering a clearer picture of where your business stands. Essentially, it's about making your life easier and your business decisions sharper, without disrupting the workflow you're already comfortable with.
Check out our Ultimate guide to FP&A software for a deep-dive into FP&A's hottest technology.
Best practices for horizontal analysis
Unfortunately, it can be easy to conduct horizontal analysis the wrong way. You want to make sure that the data you’re looking at helps guide you closer to the right strategic direction, rather than just creating noise that actually makes strategic thinking harder.
Here are some best practices for horizontal analysis:
Maintain data accuracy and consistency
As the old saying goes, ‘garbage in, garbage out.’ Any form of analysis is only as good as the data being used to create it. If your numbers are inaccurate or inconsistent from year to year, then any analysis will be worthless.
The first step in your horizontal analysis needs to be ensuring you have a clean source of data to work with, for both the current and past information. Here, you can use software to drive strategic planning.
Narrow your focus
Before you start your analysis, pick the metrics which are most important to you. If you try to analyze every financial statistic in the company, you’ll have trend lines going everywhere. Narrow down the metrics you really want to focus on; the ones you think will move the needle the most.
Don’t forget macro trends
A big driver for your trends will be the macroeconomic environment. If your revenue is trending down for the last six quarters, is that because you’re doing something wrong, or is the economy in a recession? Always take a sense check on how the rest of the world is trending.
Common pitfalls to avoid
Getting too narrow
While you want to focus on a few important metrics, you also don’t want to become fixated on one or two without context. It’s important to find a balance between watching the metrics that matter, while also having a holistic enough view to see how and why they might be trending the way that they are.
Focusing only on percentages
Broadly speaking, percentages are the best way to monitor trends as it’s easy to see the proportional change in the financial data. But, you need to be careful. A company carrying almost no debt can see a huge percentage increase with a relatively low amount of borrowing.
For example, going from $10,000 in debt to $50,000 will show a 500% increase. That’s not really a problem if the company is generating $1 million in revenue.
Overlooking data changes
You need to compare apples with apples. To do that, you need to ensure that all of the data and the way it’s calculated is the same for every period. There are a variety of ways to complete an income statement and balance sheet, and multiple legal ways to make accounting adjustments which impact the figures.
If you make any alterations to the way your figures are calculated, make sure you take a note of that in your horizontal analysis.
Conclusion: the power is in the analysis
Horizontal analysis offers a powerful lens through which finance professionals can spot trends, understand the dynamics of financial performance over time, and make informed decisions.
By leveraging the right technology and tools, such as FP&A software, this process becomes not only more efficient but also more insightful. Ultimately, horizontal analysis empowers businesses to navigate their financial landscapes with precision, ensuring strategic decisions are both data-driven and forward-looking.
Want to learn how Cube can help you make this process more efficient? Request a free demo today.