.png)
The All-in-One Financial Planning Calendar
Discover how to create an effective financial planning calendar for 2026, plus tips and tricks for improving your planning process and collaboration.
Get the template
.png)
Ultimate Quarterly Board Deck Template
Use this free quarterly board deck template to craft a compelling board meeting presentation. Then use our step-by-step guide to wow your stakeholders.
Get the template
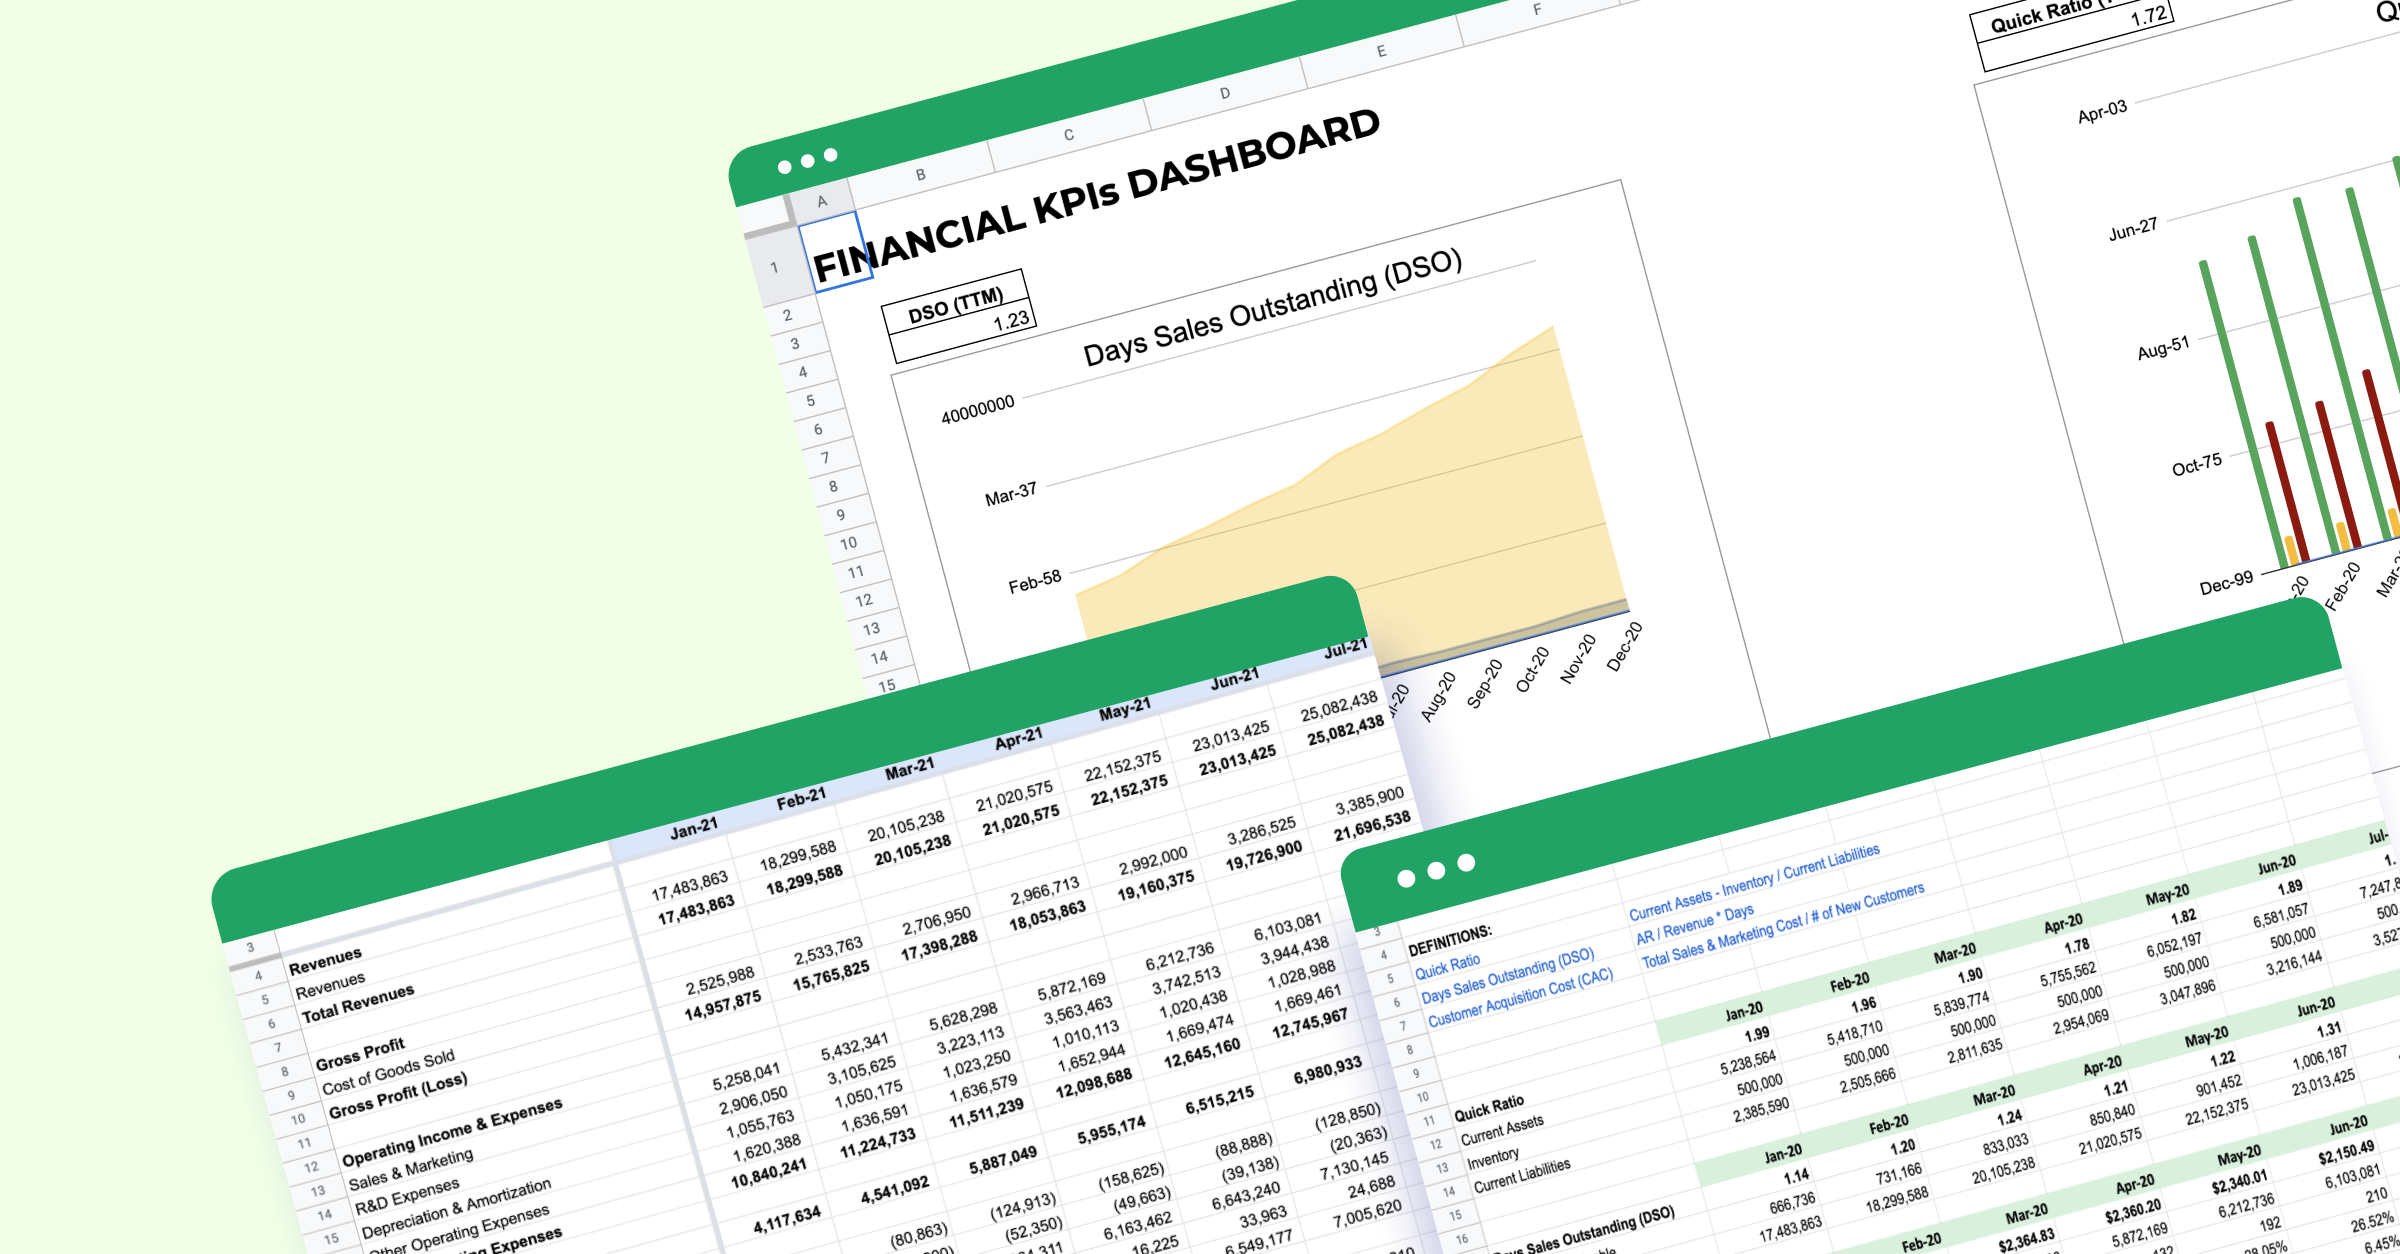
Financial KPIs Dashboard
Streamline your financial analysis with our easy-to-use KPI dashboard template.Download, customize, and compare your key metrics in one convenient view.
Get the template
Sales Quota Capacity
Easily and sustainably grow your business's sales arm with this free sales quota capacity template for Excel and Google Sheets.
Get the template
.png)
Rolling Forecast Template: 12-Month Forecasts (Excel Template)
Easily and quickly maintain a rolling 12-month forecast template for your business's operating expenses with this free Excel and Google Sheets template.
Get the template
.png)
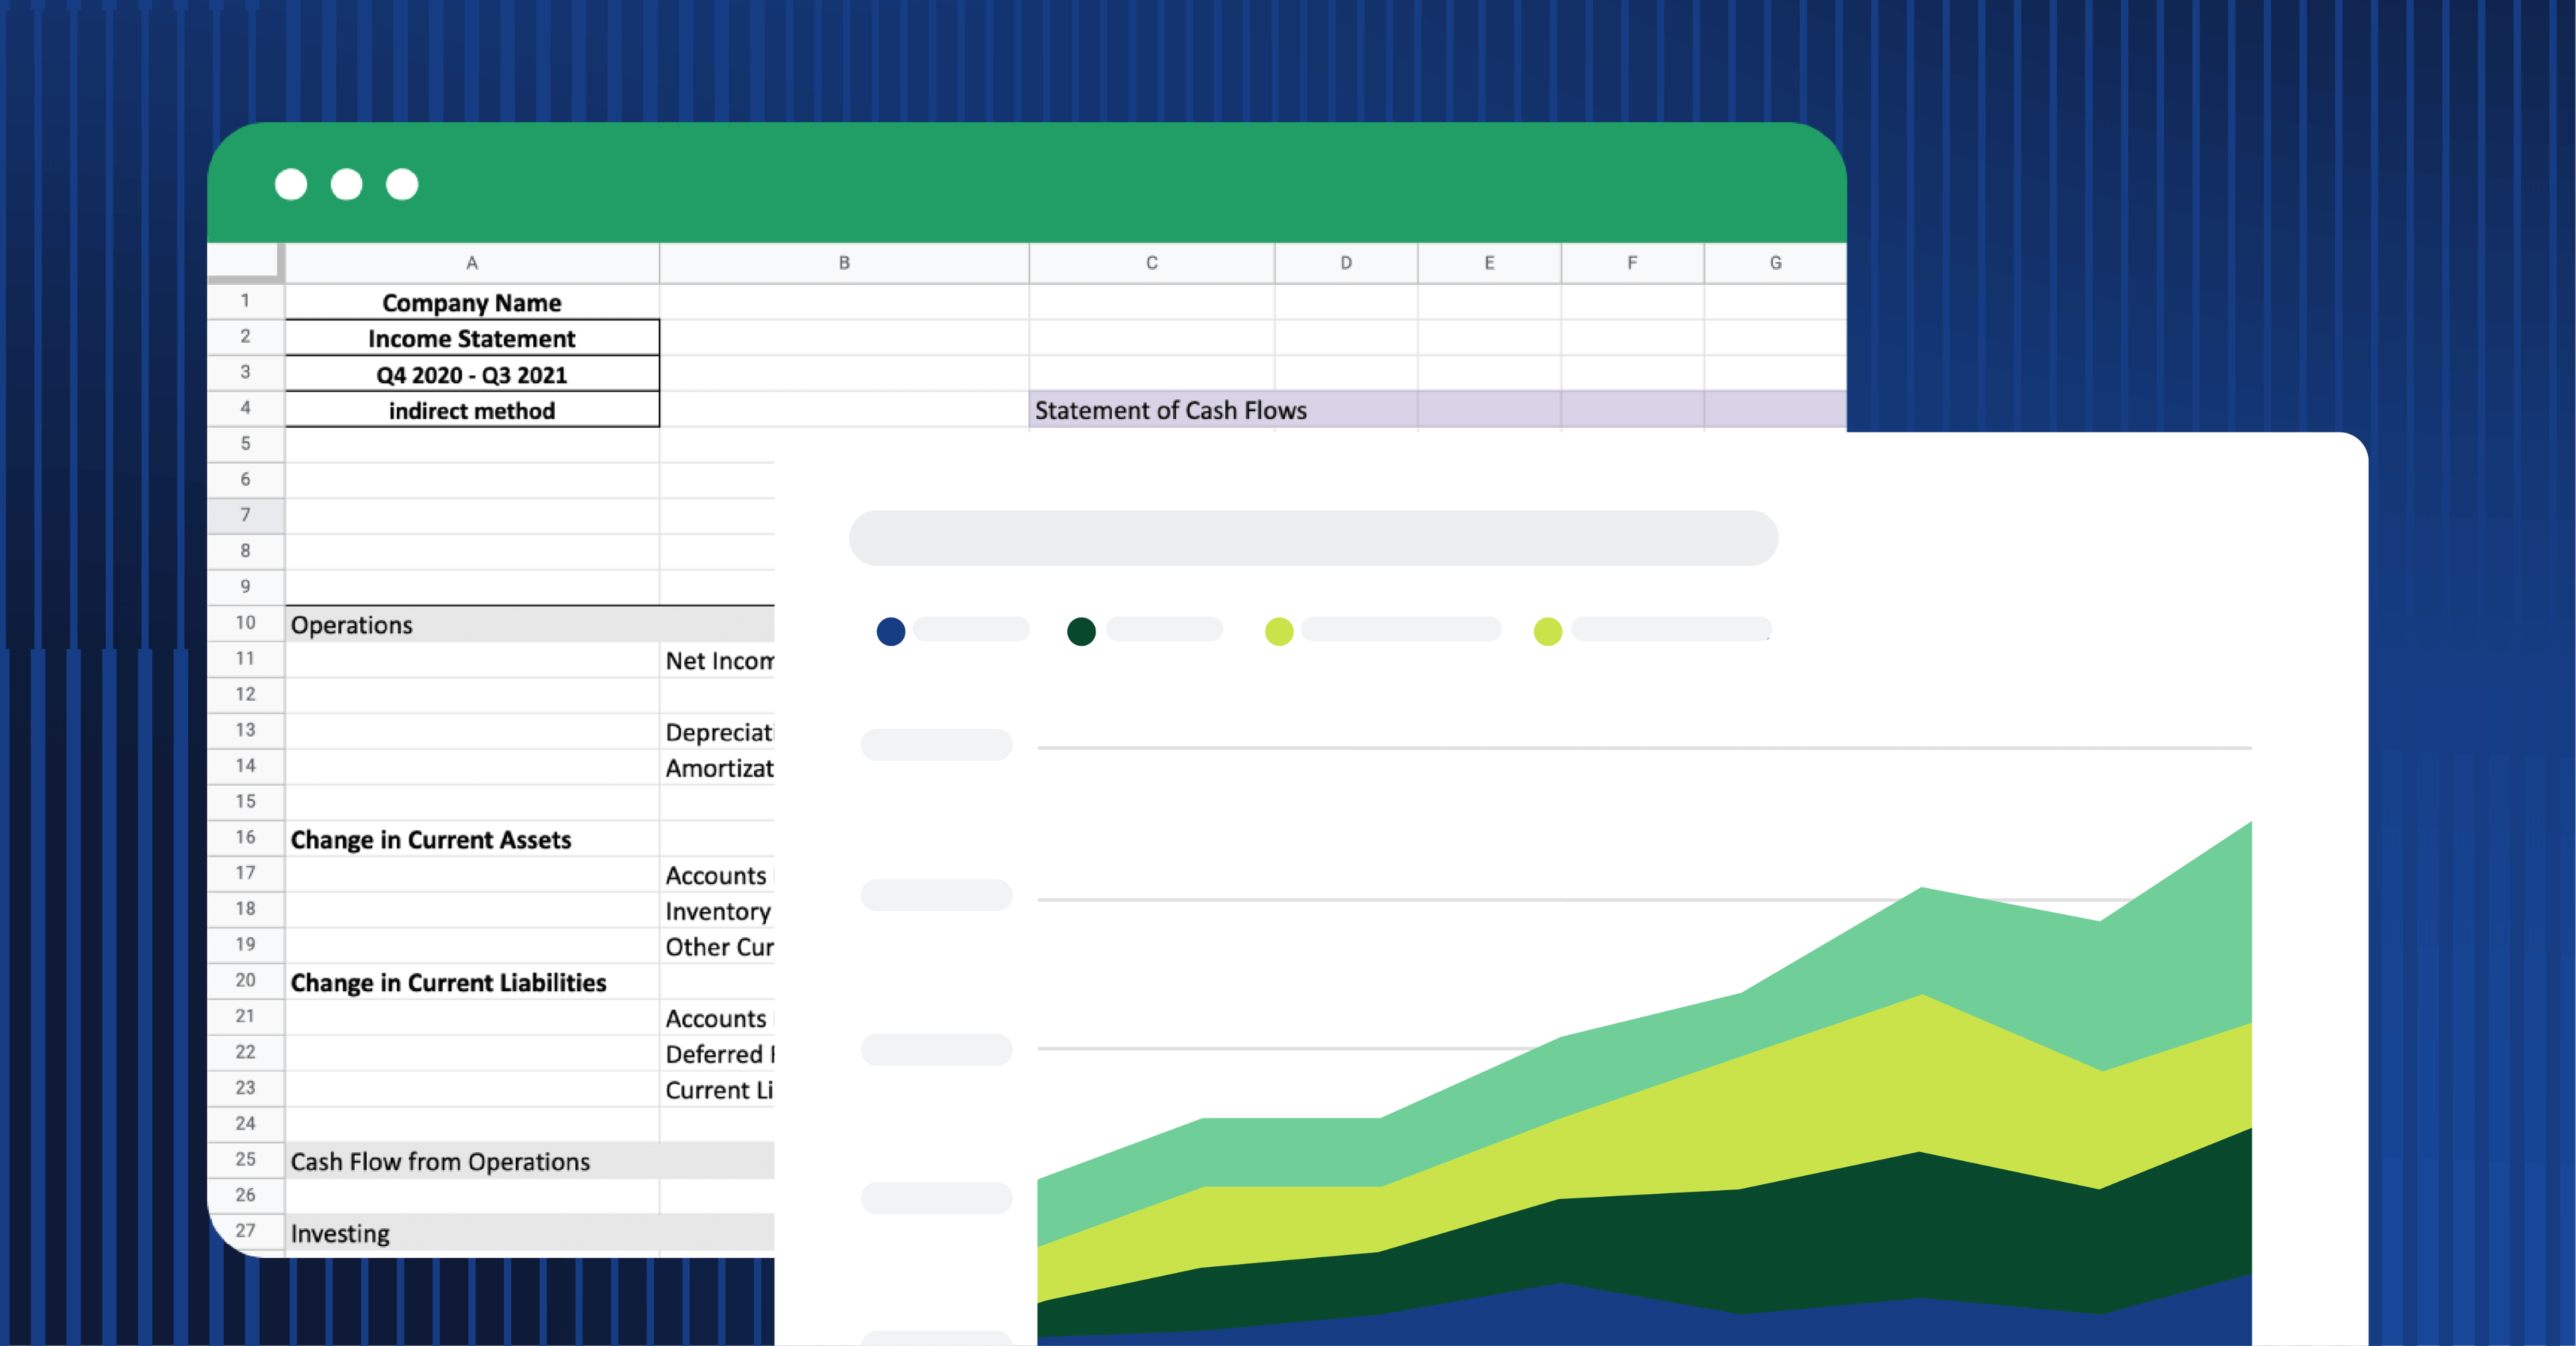
Cash Flow Statement (Excel Format Template)
Use this free cash flow statement spreadsheet template to refresh or revise your cash flow reporting and operations.
Get the template

Capital Expenditures
Calculate the associated spend and depreciation for a capital budget or forecast with this free template.
Get the template
.png)
Operating Budgeting & Planning Template
Use this operating budget template to quickly and easily collect operating expenses with this sample department budget opex collection file.
Get the template
.png)
Free Budget vs. Actual Excel Template | P&L Statements
Download our P&L Budget vs. Actual Excel template to effortlessly compare your income and expenses with the projections made during your budgeting process.
Get the template
.png)
SaaS Revenue Model
Use our free SaaS revenue model template to streamline SaaS revenue projections on Excel. Download for efficient analysis.
Get the template
.png)
Free 3-statement model template and guide
Use this free, downloadable 3-statement model template to combine your three key financial reports: income statement, balance sheet, and cash flow.
Get the template
.png)
Simple ARR Forecast (Revenue/Churn)
Download our free ARR forecasting template to compare revenue, analyze churn, and project annual recurring revenue effortlessly in Excel.
Get the template
Headcount planning template for optimal workforce planning
Streamline your headcount and workforce planning with our free, easy-to-use Excel template. Download now to effortlessly simplify the process.
Get the template