What is ad hoc reporting?
Ad hoc is a Latin term meaning "to this." However, it's better translated as "as needed."
So, something that's "ad hoc" has been constructed for a specific purpose—an ad hoc movie set, for example, has been created just for that movie.
Ad hoc reports are just like that. These critical business intelligence tools are created from scratch as needed, without building off the templates followed by traditional reports. For instance:
Say you suddenly have low sales volume. Naturally, you want to know why. While a traditional report would be too general, you could make an ad hoc report to focus on which stores are experiencing lower sales, the period during which sales started to decline, and the relation between past marketing campaigns and sales.
Like Sherlock Holmes, you'd cross-reference clues and pinpoint the reason(s) for declining sales. From there, you'd intuit a strategy to solve the problem. This process may not always be elementary, but it works.
Ad hoc reports vs. canned reports
Traditional reports—better known as canned reports—are created regularly, whether weekly, monthly, or yearly. They're made to be distributed to stakeholders, to keep existing investors happy, and to attract new ones.
That's not to say they don't provide helpful insights—they do. The problem is that fixed templates are limited and can't be customized to specific data sets or fields.
Canned reports are inflexible, static reports. They're much like an old movie set, unable to respond to specific issues or adjust to changing scenes. In contrast, ad hoc reports are like puzzle pieces that can be molded to fit specific gaps in a business's puzzle, providing solutions that address challenges as they arise.
So when it comes to reporting and analysis, customization is the name of the game. Ad hoc reports can include any available data sets or fields. These can be filtered, sorted, and grouped in any way the user chooses. This high level of customization provides fast, detailed insights that enable employees to make informed decisions quickly.
The two types of reports often play off each other. Canned reports, for instance, can guide the ad hoc report to answer specific business questions you might not otherwise have asked. Let's say your canned report shows a product is not performing as well as expected. Ok, fine—what can we do about it?
An ad hoc report jumps into the same underlying data. It analyzes customer feedback, identifies areas for improvement in product design or marketing, and determines if any geographic/demographic questions are at play.
These flexible reports hone in on questions like "What is our top-selling product?" or "What are the most common customer complaints?" They're meant to be acted on quickly, so they're usually presented in an easy-to-understand format and are simple to generate.
Canned reports provide a regular snapshot of business operations, while ad hoc reports allow for more in-depth analysis. This brings us nicely to the next section:
What is ad hoc analysis?
Ad hoc analysis is the other side of the coin from ad hoc reporting—it's a deep dive into the business data provided by that reporting, and this is really where the magic happens.
Interactivity is a critical component of ad hoc analysis, typically conducted in real-time or near real-time. Interactive ad hoc reports enable users to access and manipulate data in a flexible, customizable way. You can sort of operate "on the fly" and dig deep to identify trends and actionable insights that aren't obvious in pre-defined reports or dashboards.
To do this, ad hoc analysis involves data visualization tools to explore the data. With these tools, you can create customized queries, charts, or pivot tables. They can also perform advanced analytics like regression analysis, clustering, or predictive modeling.
Remember that cool, interactive screen Tom Cruise used in Minority Report, which he could manipulate with his hands? With ad hoc analysis, you'll be like that, quickly sorting through all relevant data and doing deep dives easily.
Ad hoc analysis is a responsive process—you might discover an insight that leads to another question, another area you can analyze. Each question builds on the next until you have a thorough, granular understanding of a specific area of your business, one that canned reporting could never allow for.
Through answering all these questions, the data reports provided by ad hoc analysis are vital for helping organizations make better, more informed decisions.

How to create an ad hoc report
If you want to create your own reports, following a process helps.
Here's a quick, bare-bones one to get you started.
1. Define your purpose
The first thing to do to perform ad hoc reporting is to determine the report's purpose.
What information is required, and what format should it take?
What problem are you trying to solve?
2. Find and collect the data
Next, find out where the data you'll need is located—which databases or spreadsheets contain it?
Collecting the data may involve running queries or using reporting tools to extract the relevant data.
3. Choose a reporting tool
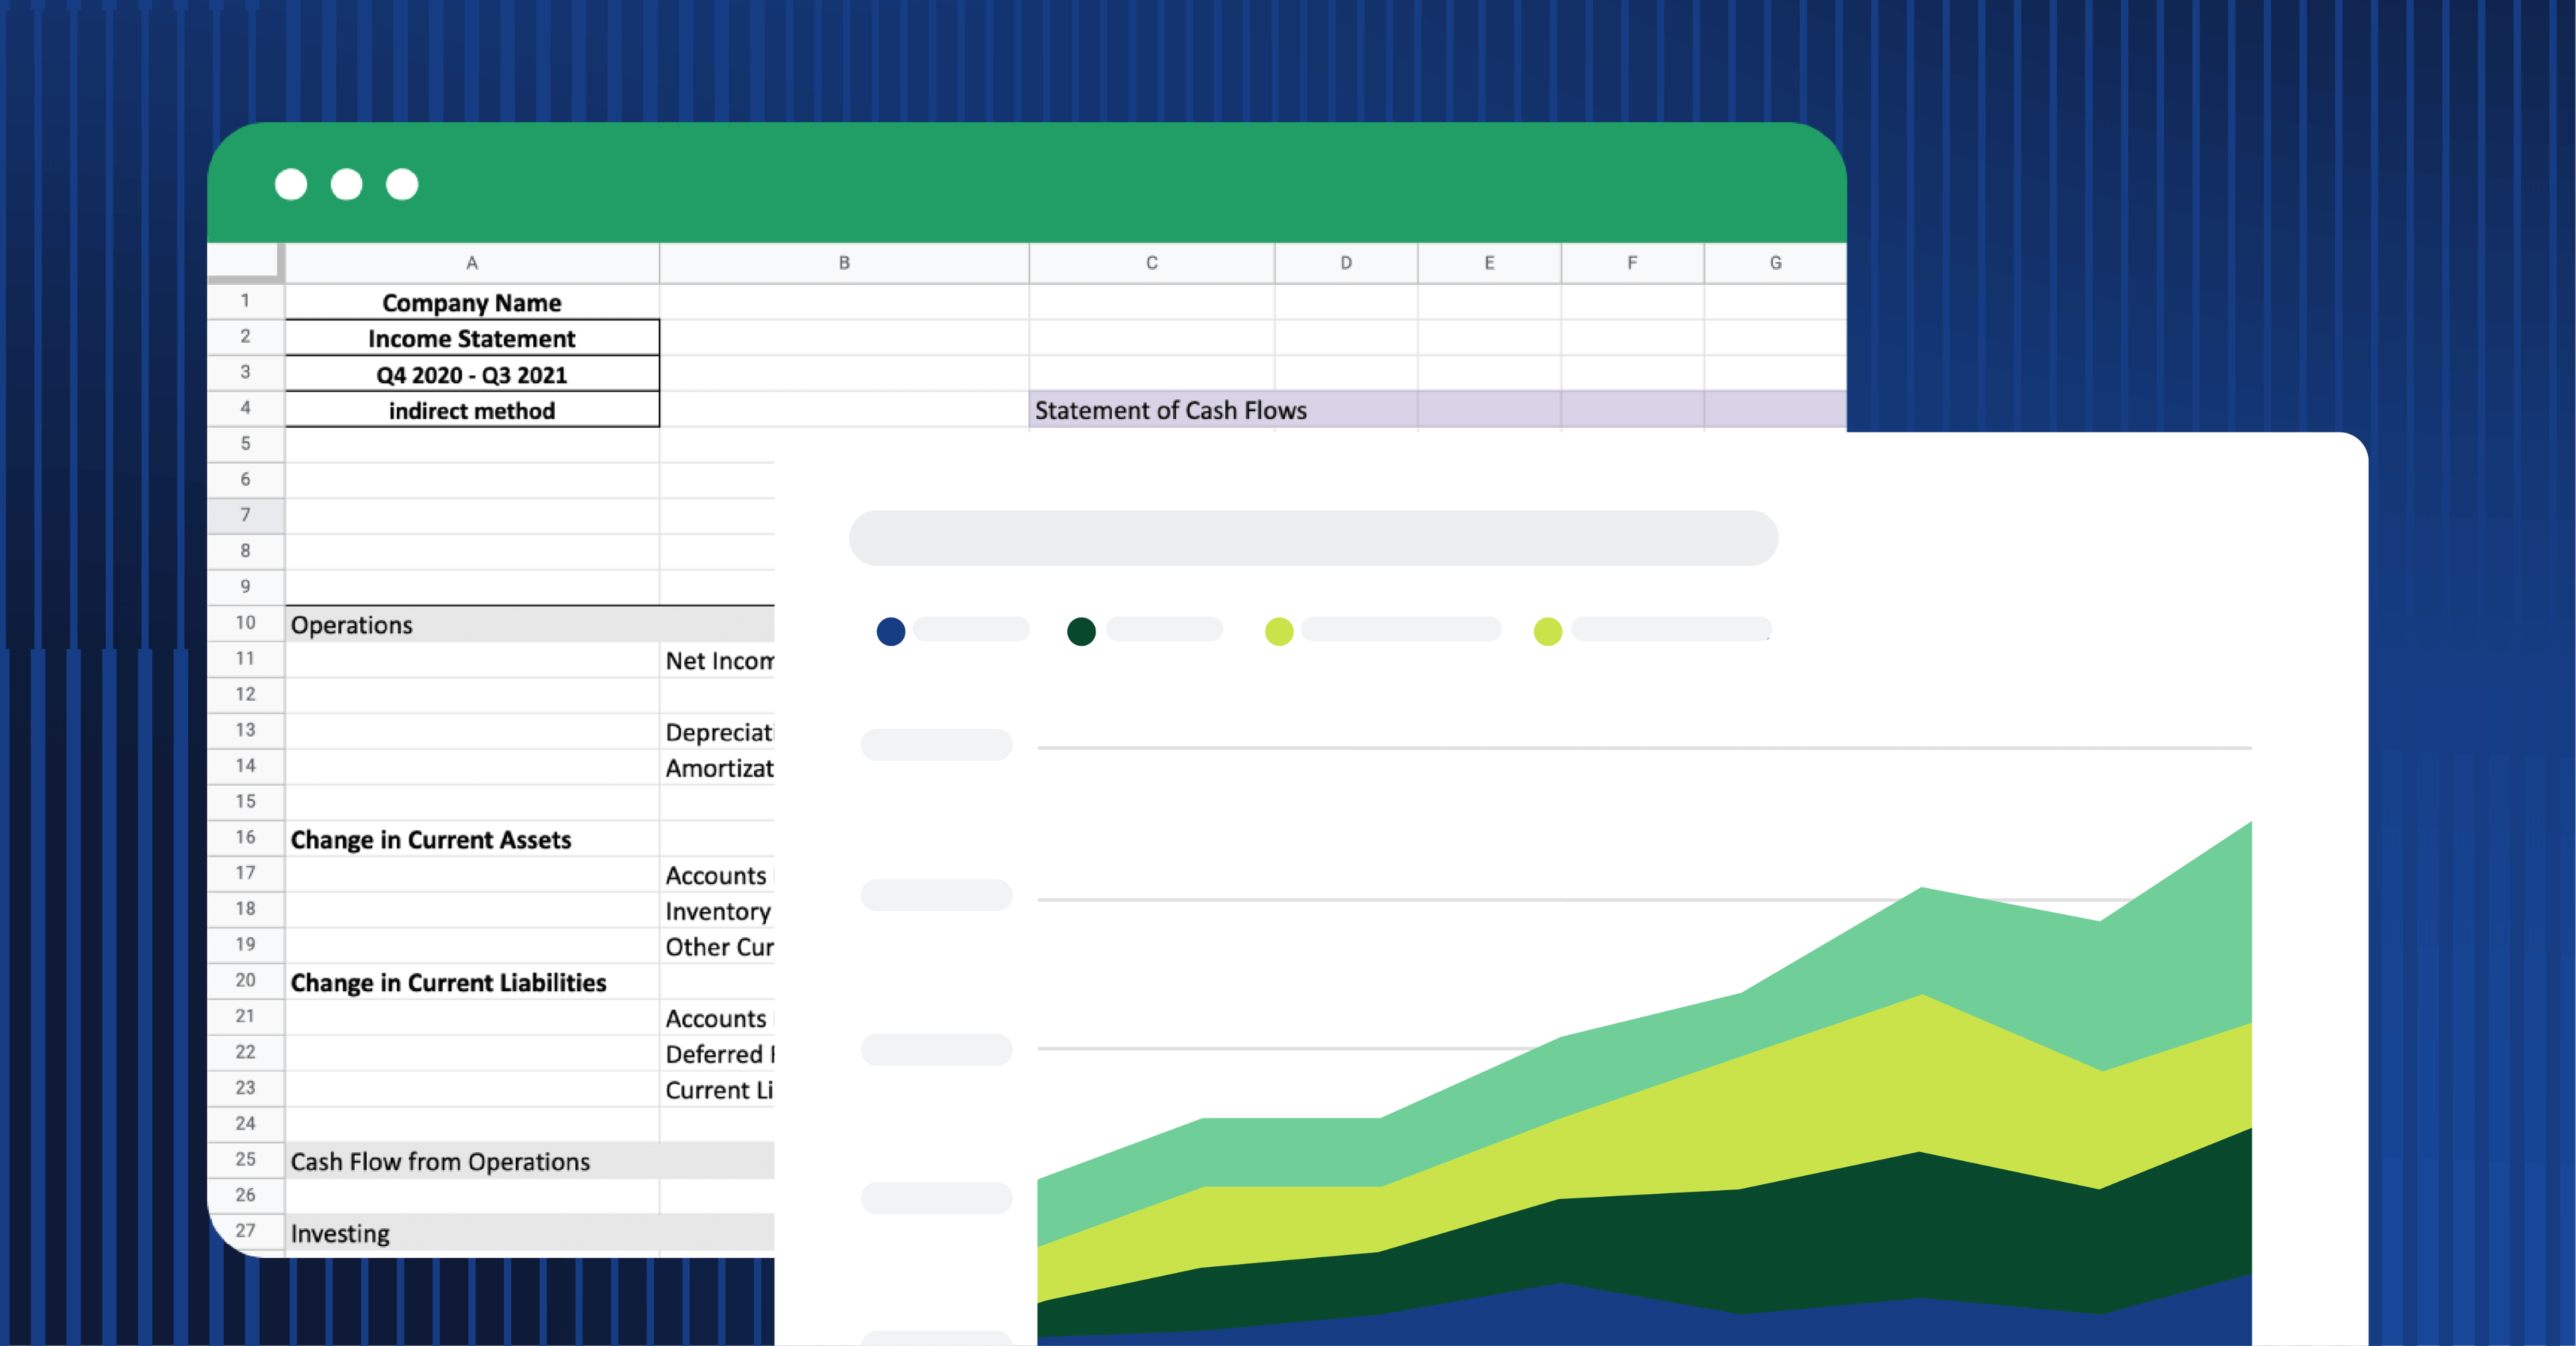
There are many reporting tools available that can help you construct an ad hoc report, like Microsoft Excel.
Choose a tool that has the features you need to generate the kind of report you want—the ability to customize is, after all, one of the most engaging parts of ad hoc reporting!
4. Define the report parameters
So you've got your data and have chosen a reporting tool. Next, you need to define the parameters of the report.
This is a bit drier than the last step—it includes defining the data fields and metrics you will use and any filters or criteria that need to be applied.
5. Generate the report
With the parameters defined, you can finally generate the report.
This may involve dragging and dropping fields, applying filters, or creating charts and graphs to visualize the data.
Remember that ad hoc reports are supposed to be simple—if there's too much data, consider creating multiple reports and presenting them together if necessary.
6. Perform ad hoc analysis
Analyze the report data to identify insights, patterns, and trends.
7. Refine and iterate
After generating the report and analyzing the data, refining, and iterating on the report to improve its accuracy and usefulness is important.
This may involve adjusting the filters or criteria, changing the visualizations to emphasize the main report elements, or including additional data fields to get a fuller view of the problem.
8. Share the report
Once the report is finalized, it's time to share it with the relevant stakeholders. This could include managers, team members, or clients who need to see the information to make informed decisions.
Consider the format in which you will share the report—will it be a PDF, an interactive dashboard, or a presentation?
Ensure that the report is easily accessible and understandable for the audience (if they're outside your department, they won't have the same knowledge you have—explain things).
Benefits of ad hoc reporting
There's a lot to like about an ad hoc reporting approach in your business.
From ease to control over your reports, there's much to cover.
Let's get into it.
Flexibility
Ad hoc reporting allows for flexibility not permitted by standard reporting.
If you need a quick answer to something that's come up suddenly, ad hoc reporting provides a way to collate organizational data rapidly and act on it.
When companies can act on unexpected events quickly—whether that's a sudden decrease in cash flow or an opportunity to invest—they gain a competitive edge.
Customization
Ad hoc reports can be customized to fit specific business needs, allowing users to view data in the best format for them (and the relevant stakeholders).
Ease of data management
With so much data, it's hard for businesses to track everything. We can only expect this problem to increase going forward. But hiring a bunch of employees just for data analysis is inefficient.
Where IT specialists must assemble traditional reports, ad hoc reports can be made by any employee with access to the right ad hoc reporting tool, saving time and money and democratizing the reporting process.
This also provides the advantage of those doing the analysis knowing their own department and better understanding what questions to ask and which solutions are realistic.
Decision-making based on real-time data
Ad hoc reporting is all about data. One of the most important perks of ad hoc reporting is the ability to view real-time data, in contrast to static canned reports.
When employees have real-time access to the needed data, they can make the best decisions for the relevant area.
Encourages collaboration
Ad hoc reports are created to answer any question.
Many of these questions may overlap between different departments, which means cross-departmental collaboration—always something good as it facilitates a more creative ad hoc solution and ensures goals are aligned.
Potential drawbacks of ad hoc reporting
But ad hoc reporting isn't perfect.
In this section, we'll overview some of the things to watch out for when performing ad hoc reporting.
Data silos
Ad hoc reports often fall victim to the problem of data silos.
This is when a business has numerous data sources that aren't consistent with one another—it may be difficult to determine which is the most current, so ad hoc reports become confused and inaccurate.
This includes having a strong data governance policy and a single data source for all employees.
Since the ability of ad hoc reports to guide the right decision-making depends on solid data, both are critical and can be offered by ad hoc reporting software.
Overreliance on ad hoc reports
As sleek as they are, ad hoc reports should not be the only thing you use. You still need to use good old-fashioned canned, static reporting.
As the name implies, ad hoc reports should be used on an "as needed" basis, an adjunct to traditional reporting when traditional reports aren't enough (which, to be fair, is often). Using both will provide the most thorough view of your business situation
Inconsistent data representation
One of the main perks of ad hoc reports is their customizability. There's no consistent format, so employees can choose how to make their reports.
But this can also be a problem—it can cause it to be hard to coordinate across departments. If multiple ad hoc reports are moving up, the person may require assistance from each developer to translate the reports.
What to look for in ad hoc reporting software
Ad hoc reporting isn't possible without the right tools and ad hoc reporting software, as business users have specific needs. Here's what to look for:
Self-service: Ad hoc reporting would only be ad hoc reporting with the ability for everyone to be data analysts to generate reports on any topic without IT involvement. This necessitates ease of use through a user-friendly interface and the ability to quickly access data.
Access to real-time data: Ad hoc reports are meant to be acted on quickly. This means the right tools need access to real-time or near-real-time data.
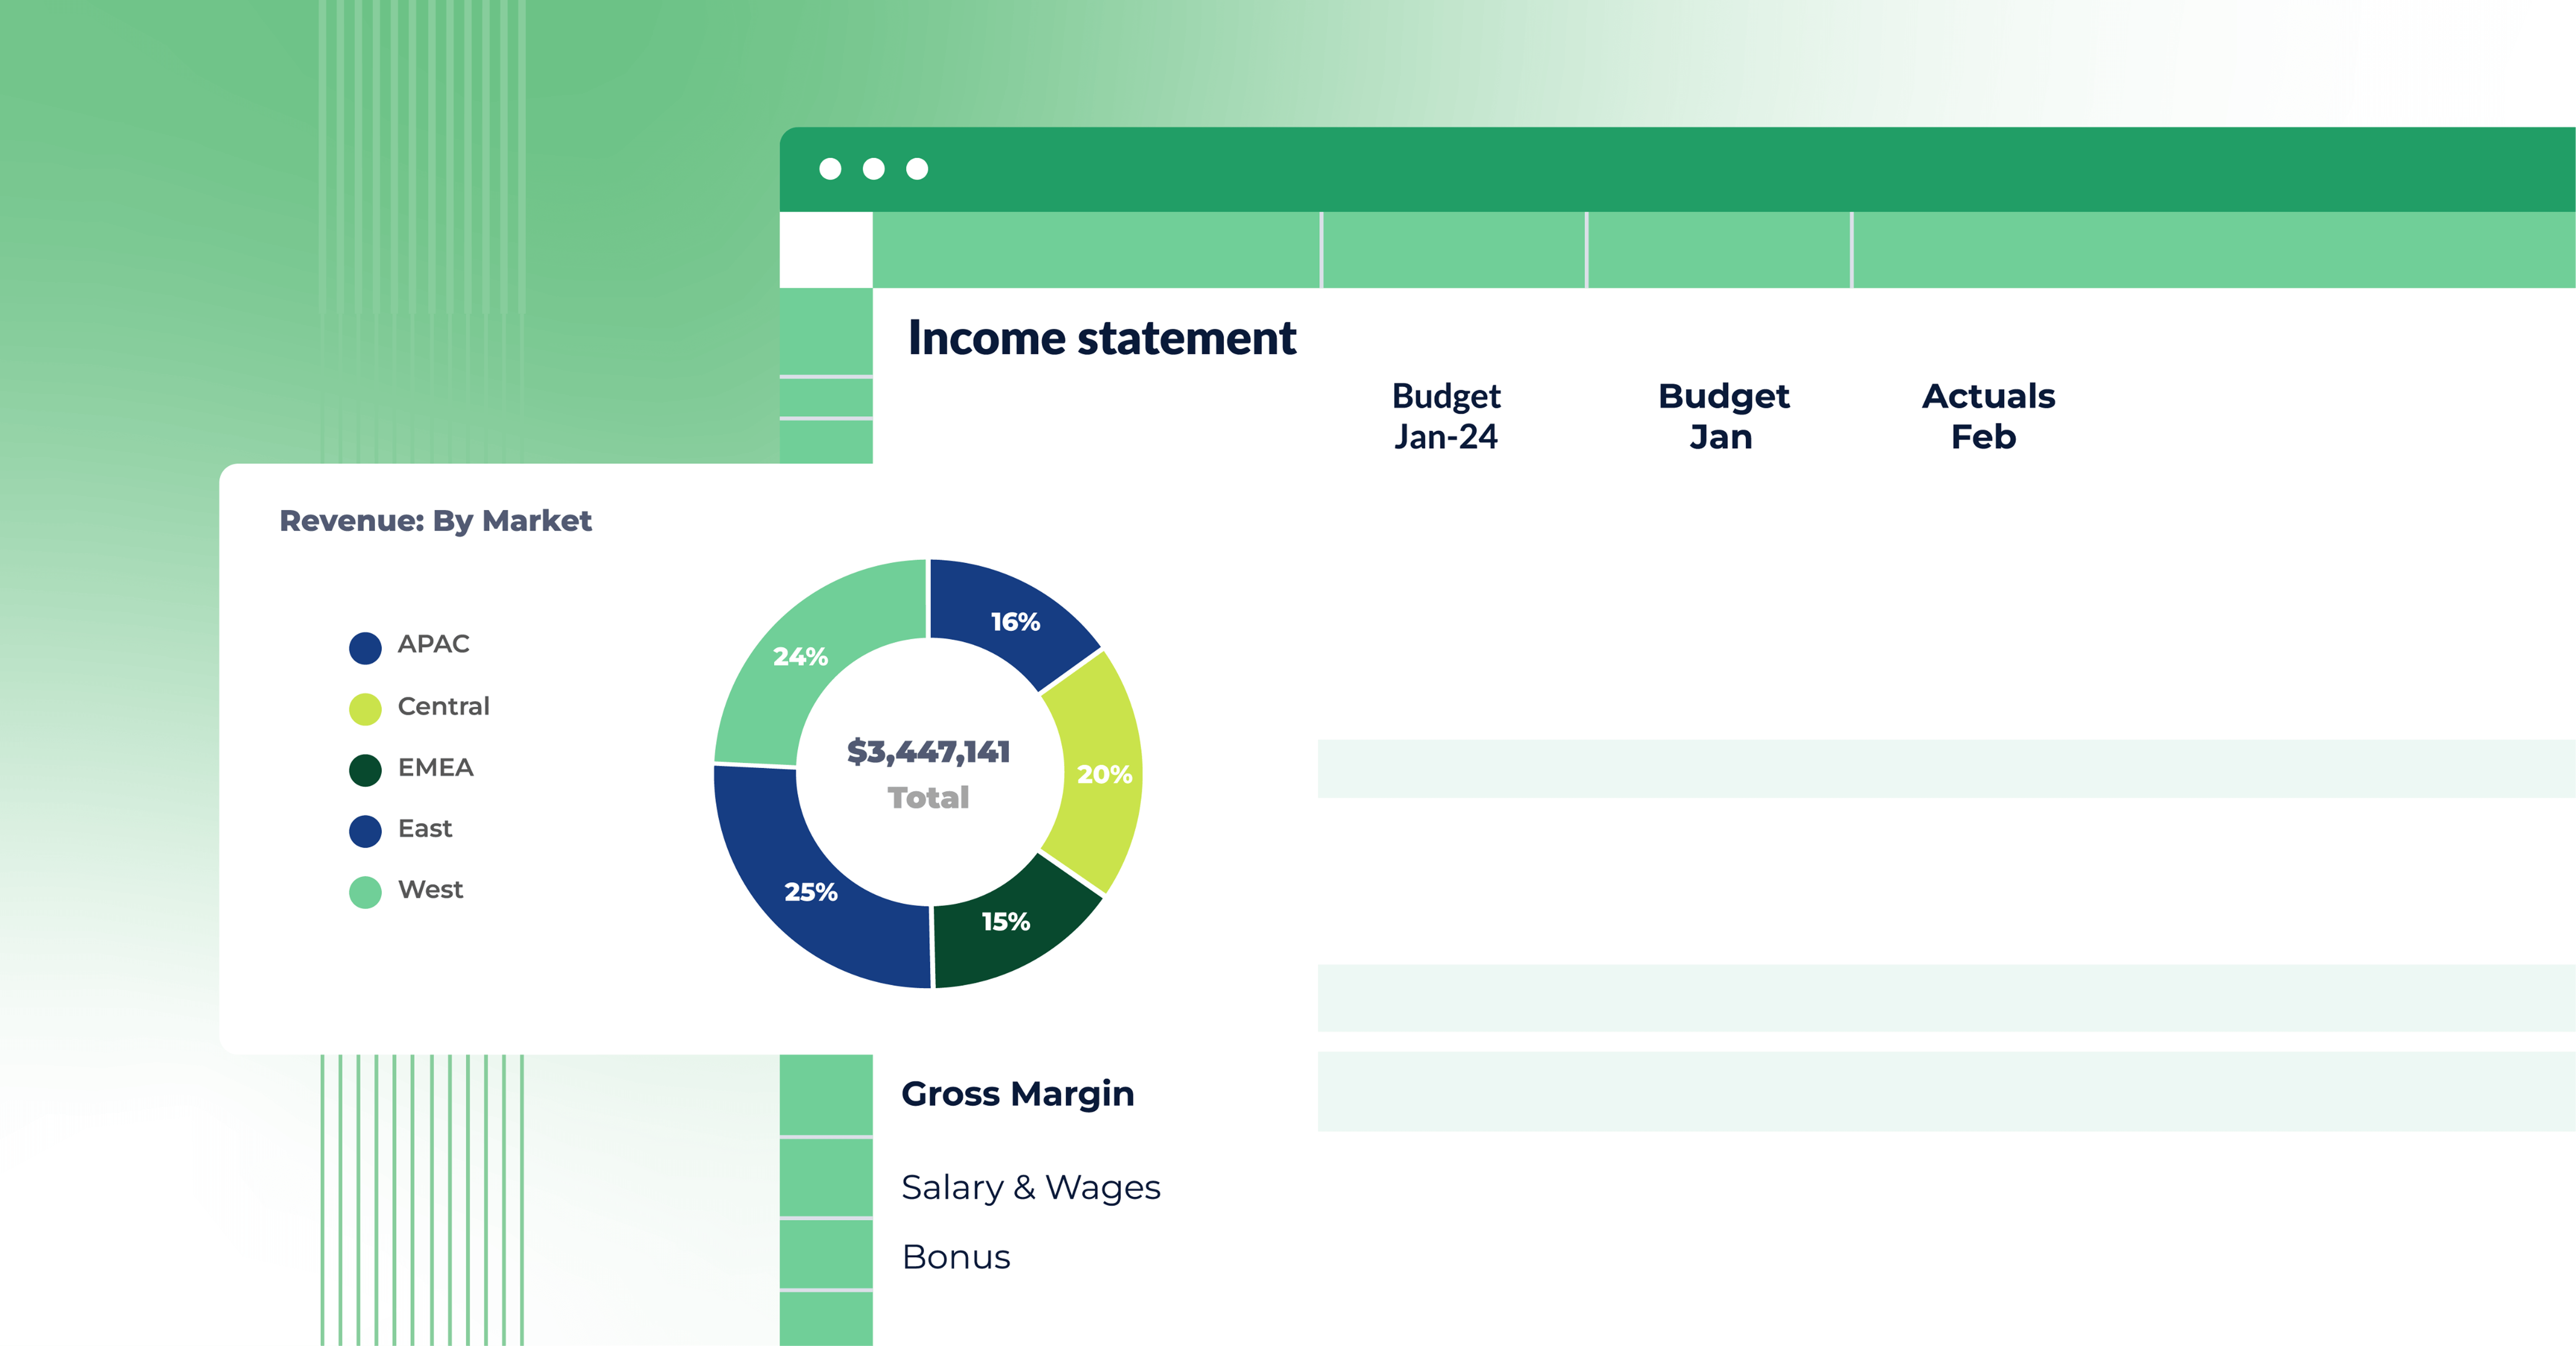
Clear data visualization: Bouncing off the last point, to act on a report quickly, data needs to be displayed in a clear, easy-to-understand way. This means access to charts and tables. These tools also allow for deep dive, ad hoc analyses that expand on the answer to the ad hoc question.
Data centralization: For ad hoc reporting to be effective, employees need to be able to access accurate company data on the fly. Storing data in one centralized location, such as a data warehouse, is one of the best ways of ensuring this happens.
Integration: The tool should be able to integrate with other systems, like CRM or ERP, to provide a comprehensive view of operations.
Shareability: Part of ad hoc reporting is collaboration and the ability to share findings with others. Look for ad hoc tools that make sharing reports and dashboards with colleagues and stakeholders easy.
Customizability: Ad hoc reports are all about flexibility, and the right tools should enable you to customize the report however you see fit. This includes choosing specific data sources, filters, and columns to include in the report.
Scalability: As your business grows, so does the financial data you collect. Ensure the ad hoc tool you choose is scalable and can handle large volumes of data without slowing down or crashing.
Security: Any tool you use for ad hoc reporting should have robust security measures to protect sensitive data. This includes access controls, encryption, and other security features to prevent unauthorized access or data breaches.
Choosing the right ad hoc tools is essential for making the most of your data and driving better business decisions. Consider these features as you evaluate different options to ensure you select the best tool for your needs.
Conclusion: all about ad hoc reporting
Now you know all about ad hoc reporting.
What it is, why it's useful, and even how to find a tool to help you do it.
And that's why you should consider Cube.
Cube is a spreadsheet-native financial planning and analysis tool that integrates with your source systems (like your ERP) and organizes your data like a pivot table.
So you can pull your historicals into Excel (or Google Sheets) and make ad hoc reports with just a few clicks.
Sound intriguing? Click the image below to request a free demo.

![10+ Best ad hoc reporting software tools [2026]](https://www.cubesoftware.com/hubfs/Cube%20website%20-%202026/Blog%20Post%20-%20Featured%20Images/Featured%20-%20Bars%20Pie%20Chart.png)