What is variance reporting?
Variance reporting is exactly what it sounds like—finding differences between what you planned and what actual data results from your business activities. Variance reports are used to identify the occurrence and reasons for changes in the plan.
Variance reporting can show the difference between budgeted and actual results or between budgeted and forecast results. Each of these analyses helps FP&A leaders make better decisions about the company's short- and long-term financial plans.
The larger the gap, the greater the need to understand the cause(s) of the variance.
Variance analysis helps you identify the reason for the differences. Identifying and explaining variances is essential as they hold the keys to better future performance. Variances happen for various reasons (fluctuating costs, sales numbers, pricing, and overhead). They can be positive or negative.
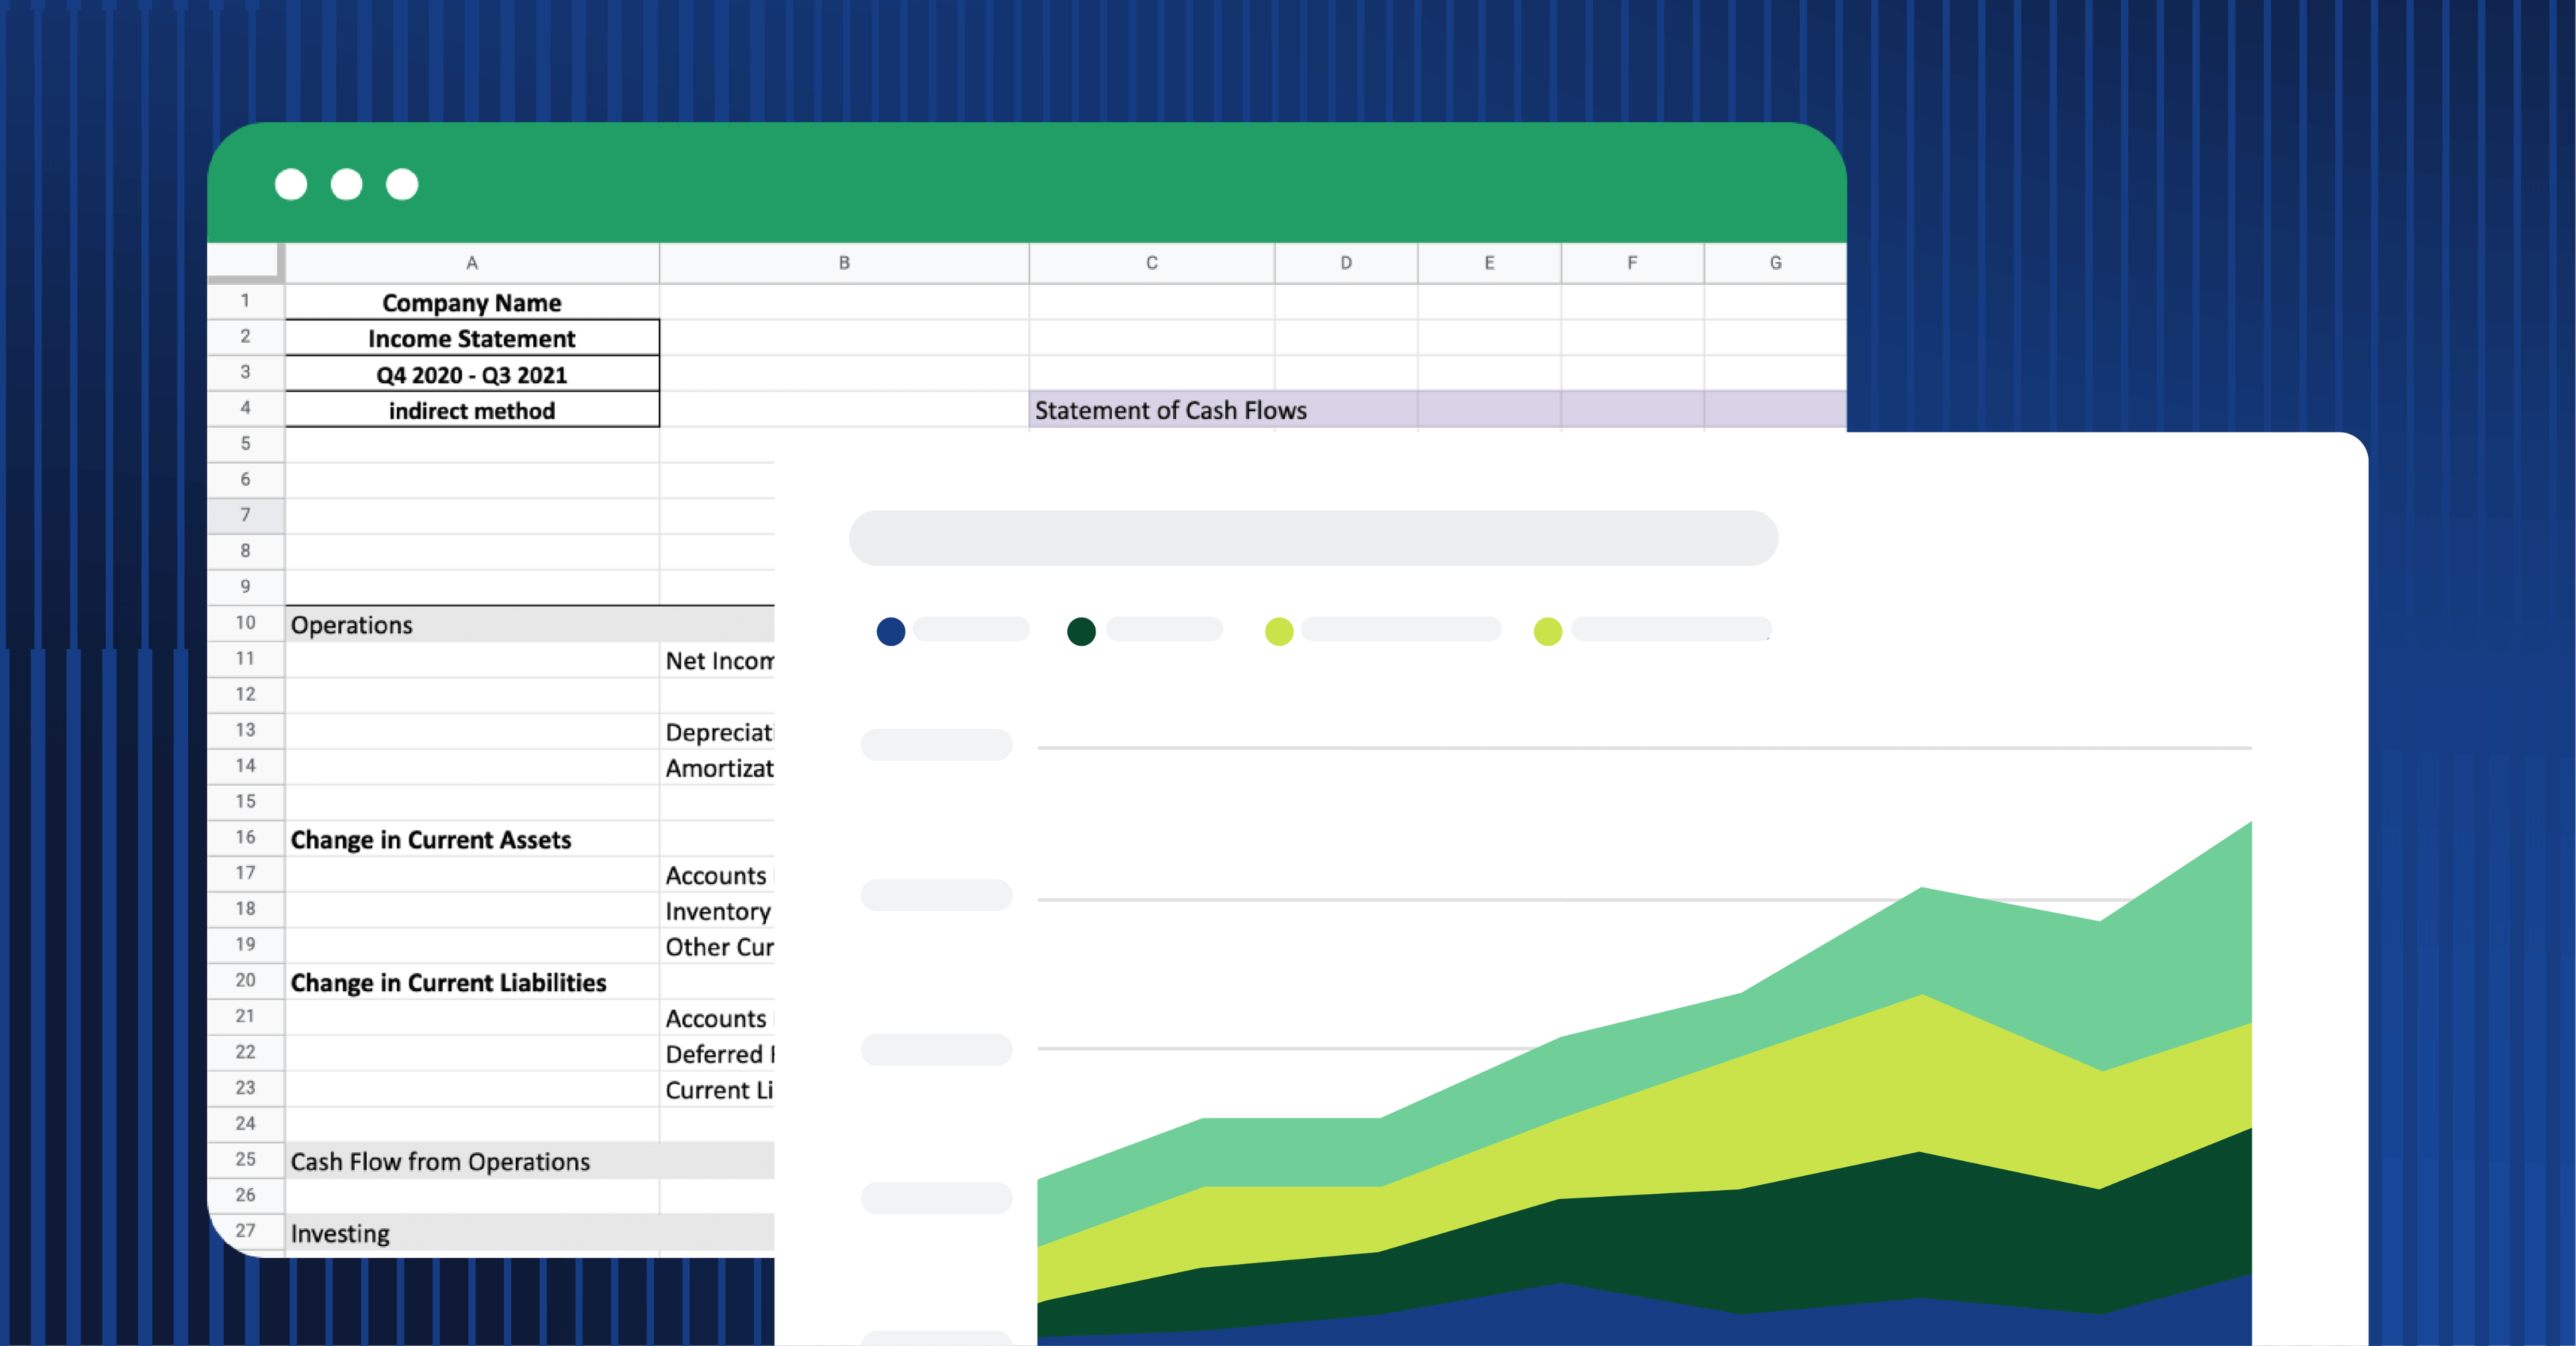
The variance report is a written document, often in the form of an Excel spreadsheet, that shows the business owner and other stakeholders the variance in revenue numbers or expenses over a specific period.
Why is variance reporting important?
Capturing and understanding variances are crucial to controlling future costs and maximizing profit. The sooner you see and handle a variance, the less likely it is to affect the organization's long-term profitability and financial health.
Positive variances are equally crucial to financial health, as they may reveal areas to improve procurement, profitability, or time to market.
Using variance reporting, companies improve the efficiency and performance of the organization:
Reduced spending: Variance reporting reveals tail spend and increased overhead costs before they can get out of control and sap profitability. By comparing actual spending versus projected spending or expected benchmarks, Finance can understand whether spending results from external forces (like inflation or supply chain issues) or uncontrolled spending.
Tighter operations: Variances in materials usage may signal the need for refining production practices within the organization. Reducing materials waste, increasing productivity, and optimizing manufacturing processes can create significant savings.
Stronger sales: Variance reports reveal areas where your data or assumptions miss the mark. Seeing and explaining variances may identify areas for improvement in marketing, procurement, logistics, or sales that will increase value creation and customer acquisition.
When is variance reporting used?
Variance reporting can be used to regularly monitor deviations between planned and actual numbers. Some organizations (typically younger and smaller companies) conduct variance analysis quarterly.
Larger companies, or companies with more complex needs, may create variance reports monthly. Conducting a variance report as part of the month-end closing procedures allows you to see issues or realize opportunities as they arise.
Significant positive or negative variances may require context in the financial reports or financial statements (like the income statement, balance sheet, and statement of cash flows) delivered to stakeholders as part of monthly financial reporting.
Predetermined variance report vs. ad hoc variance report
As described above, many organizations create variance reports at predetermined intervals throughout their fiscal year. Non-technical stakeholders may also need ad hoc variance analysis to gain an understanding of the numbers. With the right software, users can use data and create ad hoc reports without calling IT for canned reports.

How to write a variance report
Most variance reporting occurs in a spreadsheet, where you can analyze the numbers and understand the origin and impact of variances.
Templates (like this one!) allow you to quickly set up a variance report and pull in the numbers for analysis.
The two variance formulas
There are two ways to calculate variance: as a numerical dollar value and a percentage difference.
The dollar value variance formula shows the difference between actuals and the forecast as a dollar amount.
The percentage variance formula shows the difference between actuals and the forecast as a percentage
When you want to show raw dollars and cents, use the dollar value variance formula.
But when you want to show a percentage (for example, if you're interested in tracking variance over time), you should use the percentage variance formula.
Dollar value variance formula
For the dollar value variance, the formula is:
Actual - forecast = variance
Variance percentage formula
For the variance percentage, the formula is:
Actual ÷ forecast - 1 = variance
The result is a percentage.
Steps to completing a variance report
Use these steps to complete a simple variance report:
-
Organize your data: Start by separating your revenue from expenses. The revenue section should include line items like revenue, cost of goods sold (COGS), profit, EBITDA, operating income, and net income. Be sure you have complete data sources and that your data is up to date.
-
Arrange your report: Start a column for each piece of your report: The Item, the actual amount, the forecasted amount, and the variance. A fifth column can report it as positive or negative.
-
Add context: For each variance, add notes to the report to explain the variance. Identify any contextual information a reader would need to know to understand the numbers.
Your final report should be free of errors, so double-check your data points to ensure accuracy.
How to read a budget variance report
When analyzing variance reporting, you may encounter two different types of variance: Positive and negative. You may see both in different sections of the same report.
Positive variance
This is when your results outperform estimates (overall or in one aspect of the budget). Positive variances result from changes such as better-than-expected prices on materials, higher sales, lower overhead costs, or more efficient production. Positive variance is a windfall for the company.
Positive variances in one budget item can buffer against less favorable performance in another. For instance, you may miss a sales goal but produce goods at lower-than-expected cost. Look for context when the report contains offsetting variances.
Negative variance
On the other hand, a negative variance occurs when actuals underperform compared to the plan or budget. This occurs when some element of the budget is costlier than expected.
For instance, if materials estimates come in lower than actual use or labor costs to produce your product exceed the budget, the result is a negative variance.
Common variance types
Variances occur in one or more aspects of the budget or forecast. In general, fluctuations in these four areas result in accounting variances:
1. Price variance
The difference between the actual price of a good or service and the price you budgeted to pay for it.
The price variance measures how well a company can stick to its specific goods and services budget. It may also shed light on the strength of negotiation when acquiring the materials, supplies, and services used to produce a product.
Price variance may occur due to external factors such as rising commodity costs or transportation expenses.
2. Usage variance
The difference between the actual amount of a particular resource used and the amount budgeted.
This variance can be positive or negative, and it can be caused by changes in the amount of the resource used, changes in the price of the resource, or changes in the amount of the budget.
Negative variances in usage may point to poor estimates, issues in the manufacturing process, or quality control concerns due to materials lost or wastage.
3. Labor variance
The difference between budgeted and actual labor used in a given period.
Factors such as changes in the number of employees, changes in the wage rate, or changes in the level of activity can cause labor costs to fluctuate from the budget.
4. Overhead spending variance
The difference between your budgeted and actual overhead costs. Many factors can influence this variance, including the use of resources and changes in the rate at which these resources are used.
Overhead spending variances impact profitability by increasing or decreasing your net income.
How can you reduce budget variances?
Suppose your actuals are drifting from the plan or forecast. In that case, these steps can help you understand the shifts and improve future planning exercises:
-
Identify the variance: What’s happening in the budget or forecast? Where is the variance occurring? Identifying where (and when) things deviate from the plan helps you contextualize the change and adjust as necessary. Is this a specific event or a trend variance occurring over time?
-
Understand the timing: Ensure your variance isn’t a matter of incomplete data. Check that the variance isn’t a misalignment in accruals (for instance, invoices recognized but not yet received for payment).
-
Investigate and refine: Identify the root of the variance and whether it requires adjustments to your budget due to changing market conditions. Based on this assessment, make necessary adjustments to projections, pricing, sales activities, or production practices to course-correct a variance.
Conclusion: variance reporting explained
Calculating and understanding variances helps Finance make better financial decisions and keep the company’s position strong.
Want even more robust reporting capabilities?
Schedule a demo of Cube and bring powerful FP&A software to all your financial activities while keeping the spreadsheets your team knows and loves.

![13 best variance analysis software [2026]](https://www.cubesoftware.com/hubfs/Cube%20website%20-%202026/Blog%20Post%20-%20Featured%20Images/Featured%20-%20Sheet%20file.png)