KPIs: the key to organizational health
Key Performance Indicators (KPIs) are pivotal tools for gauging the health of an organization. Curious about the profitability of a product? Delve into the gross profit margin. Keen on understanding the expense to onboard new customers? Dive into the customer acquisition costs.
The true power of KPIs emerges when they are analyzed collectively. Just as pieces of a puzzle come together to reveal the bigger picture, understanding the interplay between various KPIs helps you plan strategically, identify blind spots, and uncover comprehensive insights that guide decision-making.
In essence, keeping track of KPIs not only helps you achieve organizational health, but it empowers you to improve organizational health as your business evolves over time. Let's dive deeper into each of these phases:
Phase 1: Achieving organizational health
Monitoring KPIs offers a detailed view of organizational health, shaping our understanding of its strengths and areas of improvement. But for a holistic approach to organizational success, we need to focus on key pillars that form the foundation of a resilient organization. Here are the essential elements to consider:
- Unified leadership: At the core of a robust organization is a cohesive leadership team. Disparate goals can hinder progress, and it's essential for leaders to be in sync.
- Transparent communication: Ensuring that all team members have access to consistent data is paramount. Misaligned information or cloudy communication can obstruct a clear organizational direction.
- Clear indicators: Some markers of healthy organizations, like financial stability and high employee loyalty, are straightforward. Yet, it's the nuanced understanding of these through KPIs that makes the difference.
- The power of benchmarking: Beyond direct indicators, benchmarking emerges as an essential tool. Comparing your KPIs with those of industry leaders gives a relative performance measure, spotlighting areas of competitive strength or areas needing attention.
With a strong foundation built on these pillars, guided by the insights from your KPIs, you're well on your way to achieving and maintaining optimal organizational health.
Phase 2: Improving organizational health
Building upon the foundation established in Phase 1, the next step is ensuring that this health is not just maintained but continuously improved. Let's explore the components that make this possible:
- Dynamic monitoring: Organizational health isn't a one-time achievement; it's a perpetual endeavor. As such, it's imperative to consistently assess your KPIs. Be cognizant of the fact that the relevance of certain indicators might shift with evolving business strategies.
- Future insights from past data: KPIs aren't mere reflections of what has transpired; they hold the key to foreseeing what lies ahead. Extracting insights from past data, like identifying trends, can offer invaluable predictions on how similar situations might unfold in the future.
- Proactive responses: KPIs can also function as early warning systems. For instance, a rising customer churn rate signals an immediate need to reevaluate aspects like product quality or marketing strategies.
By actively integrating these elements into your strategy and staying attuned to KPI-driven insights, you pave the way for sustained and improved organizational health.

Top 10 KPIs to track for improving organizational health
Let's take a look at some of the most important KPIs to measure organizational health.
1. Gross profit margin
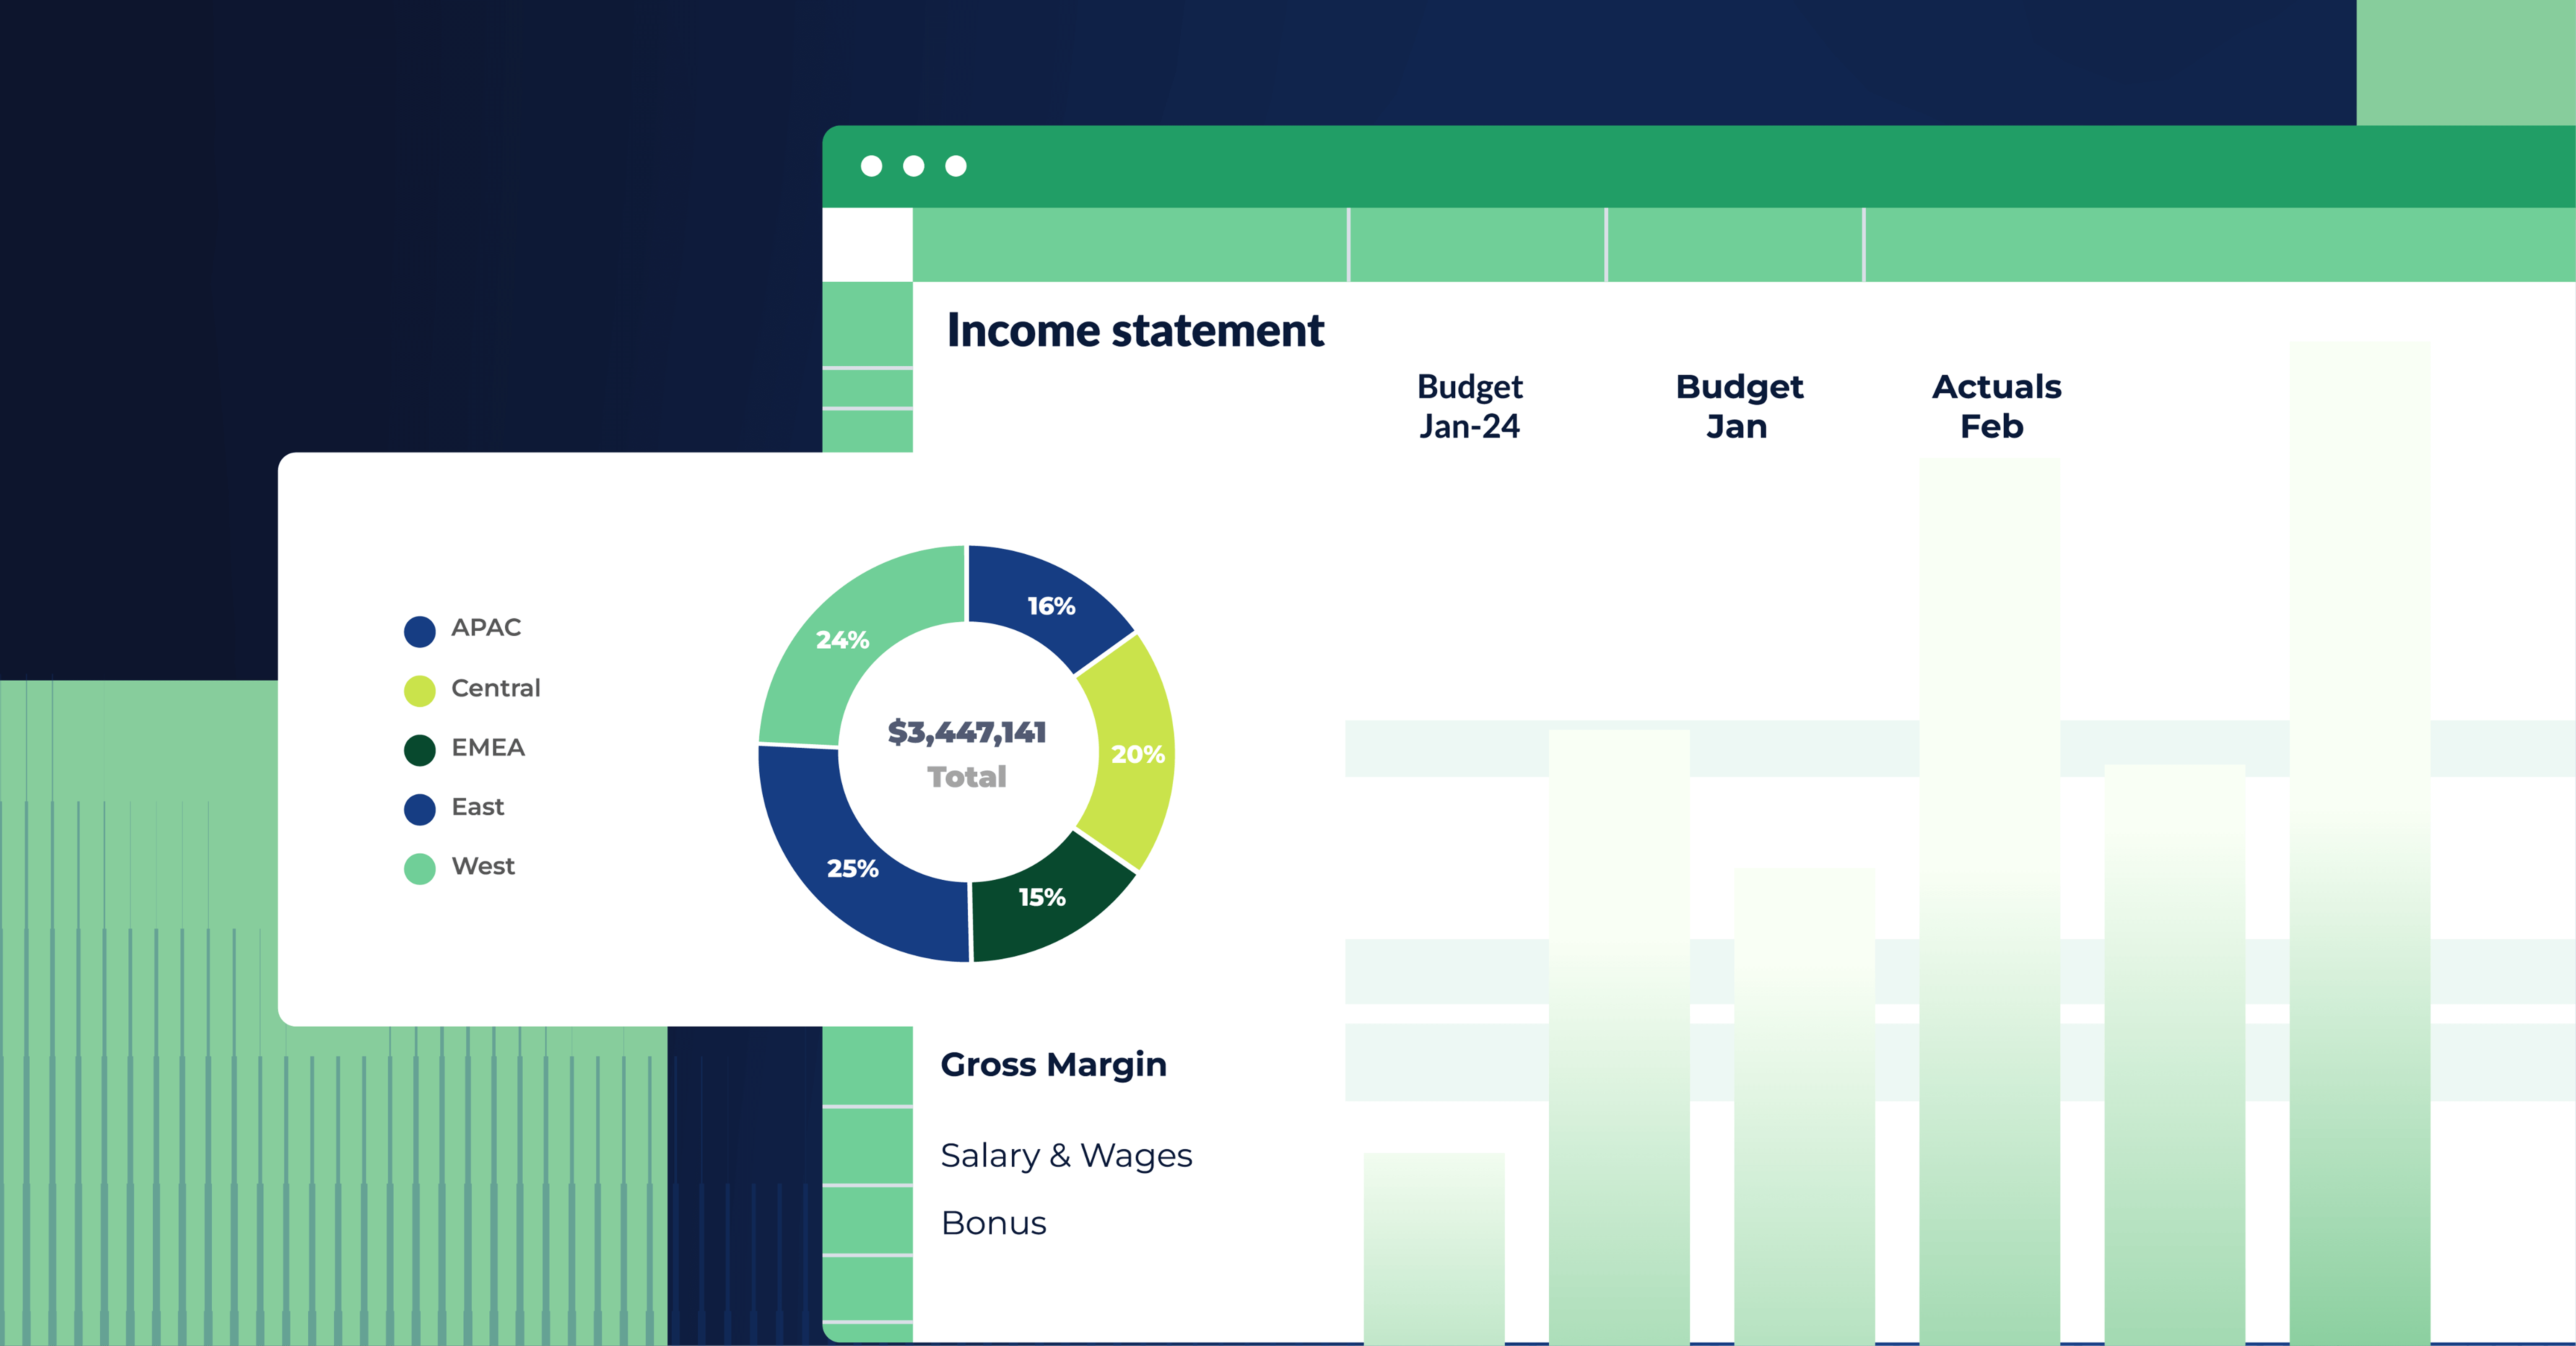
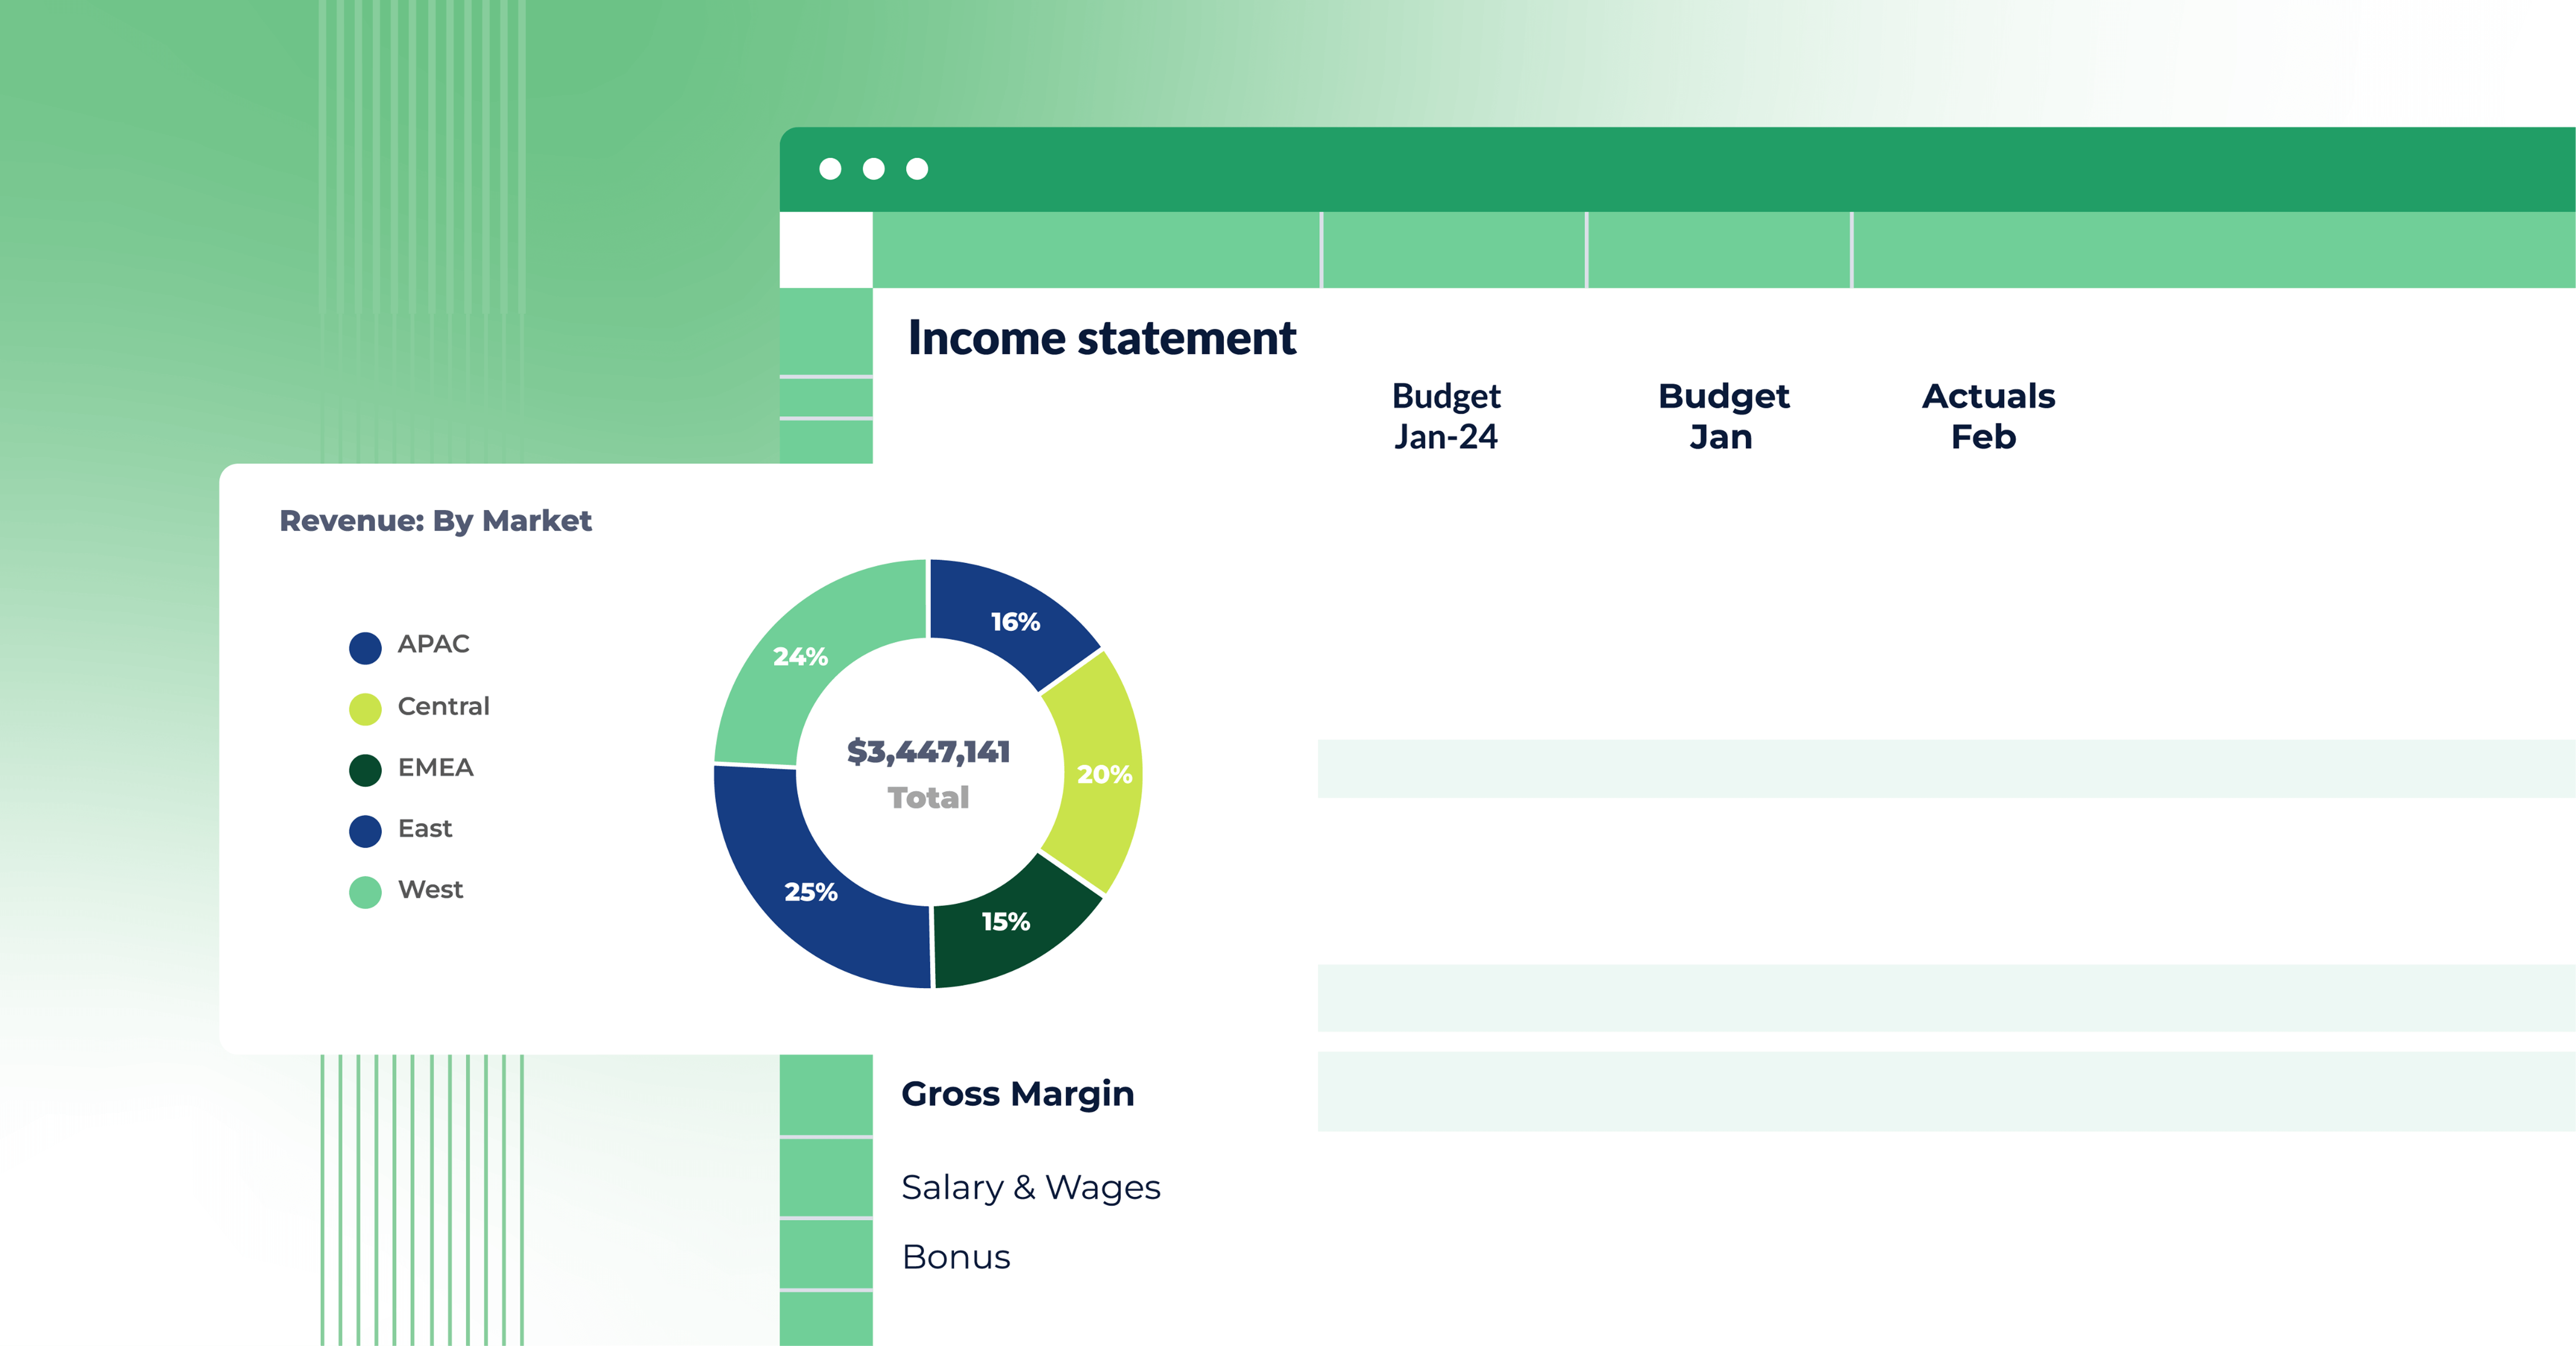
Gross profit is one of your most important metrics, showing core profitability. Core profitability is the amount your product earns after accounting for the cost of making that product—your cost of goods sold, also known as direct costs. You'll find direct costs/cost of goods sold on the income statement.
The formula for gross profit margin is:
(Revenue / Cost of Goods Sold) x 100
What's a good result? Well, you'll definitely want your gross profit margin to be above 0 (that means revenue is covering direct costs). Beyond that, though, what constitutes a "good" gross profit margin depends on your industry.
For instance, clothing retailers have high direct costs, meaning they have lower profit margins. Software companies have comparatively low direct costs, meaning profit margins above 60% are the norm. Use industry benchmarks and compare to direct competitors when trying to find the right gross profit margin for you.
If you find you need to raise the gross profit margin, you have two options: raise prices, or lower direct costs. Lowering direct costs, rather than raising prices, is often the safer route for healthy companies as it avoids alienating price-sensitive customers and can enhance operational efficiency. However, achieving reduced costs may require strategies like renegotiating with suppliers or adopting new technologies, which can be challenging.
2. Operating expenses ratio (OER)
The operating expenses ratio shows what portion of your earnings is being spent on day-to-day operating expenses. This metric can be used broadly to assess overall operational expenses or, in industries like real estate, to analyze costs associated with specific properties.
The formula for operating expenses ratio is:
Operating Expenses / Revenues
Your goal should be to keep this number as low as you (reasonably) can.
3. Current ratio
When it comes to assessing short-term organizational health, the current ratio (or working capital ratio) is your go-to option.
The current ratio looks at short-term assets and liabilities (in other words, current ones). Anything that can be liquefied within 12 months, or that is due within 12 months, is considered current. You'll find current assets and current liabilities on your balance sheet.
The formula for current ratio is:
Current Assets / Current Liabilities
A result of 1 or higher means you're in no danger of being unable to pay liabilities over the next 12 months. At the same time, a healthy organization wouldn't want this number to be too high—a high current ratio can mean you're not using your money effectively for growth. Anything between 2-3 is ideal.
4. Return on equity (ROE)
Return on equity is one of several profitability metrics. Specifically, it shows you how effectively you're turning each dollar of shareholder investment into profit. The return on equity formula is:
Net Income / Shareholder's Equity
A high return on equity will make your company more attractive to investors. If you're financing primarily through equity, this is a metric you'll really want to focus on.
5. Days sales outstanding (DSO)
If you work in finance you'll know it's one thing to make a sale, but another entirely to collect that money. Days sales outstanding shows you the average amount of time it takes to do so. What you're isolating with this metric is the efficiency of your accounts receivable process.
The formula for days sales outstanding is:
(Average Account Receivable / Total Revenue) x Number of Days in Period
The lower the result, the better, as it means you have more cash on hand at any one time.
There are many options to speed up your accounts receivable process: consider shortening repayment terms, offering early payment discounts, or securing prepayment. Be sure to consider how these options may affect your sales.
6. Days payable outstanding (DPO)
Days payable outstanding is the other side of the cash flow coin from DSO. Here, we're looking at outflows (i.e., how long it takes you to pay the money that you owe).
The formula to calculate days payable outstanding is:
Accounts Payable / Average Daily Cost of Sales
More cash on hand is always better, so keep this as long as you can without jeopardizing relationships with vendors.
7. Days inventory outstanding (DIO)
Days inventory outstanding shows how long it takes you, on average, to sell your entire inventory.
The days inventory outstanding formula is:
(Average Inventory/ Cost of Sales) x Number of Days in Period
8. Cash conversion cycle
The cash conversion cycle looks at how long it takes to turn all of your investments into cash. That's why it brings the previous three metrics (days sales outstanding, days payable outstanding, and days inventory outstanding) together.
The formula for calculating cash conversion cycle is:
Days Inventory Outstanding + Days Sales Outstanding - Days Payable Outstanding
The lower your result, the better. This means you have more cash on hand to put towards meeting your KPI targets.
9. Employee retention rate
It's a fact that it's more expensive to hire new employees than it is to retain current ones. Low employee retention means you're losing all that experience, and have to pay new training costs.
If you find your company has revolving door syndrome, conduct exit interviews. Determine the specific problems, then make adjustments (while determining the viability of those changes in your full business context). Ensure employees are aware of opportunities for career development, and promote a healthy work-life balance.
To calculate employee retention rate, first choose a period of time, say a year. The formula is:
(Employees at the beginning of the period / employees remaining at the end of the period) x 100
10. Customer acquisition cost (CAC)
A healthy organization can't exist without customers. Customer acquisition cost shows how much it costs to gain them. It also helps isolate which advertisements are most cost-effective.
The formula for calculating CAC is:
Money spent on sales and marketing (over a specific period) / number of customers gained (during that period)
The cost of acquiring customers isn't all you need to know, however. You also need to look at how much you're earning per customer. That's customer lifetime value (LTV), a related metric.
Different ads could bring in a different customer segment. If that ad costs more but brings in customers with a higher LTV, it's a better long-term investment.
Strategic goals: the hallmark of a healthy organization
Organizational health isn't just about your financial performance. You also need strategic goals—without them, you're treading water.
However, sometimes the best way to achieve those goals can change. How will you know if that's the case? By following these three steps:
- Tying KPIs to strategic goals
- Setting targets for those KPIs
- Continuously monitoring progress towards those targets
Finance dashboards can make the third step a lot easier. They show KPIs—and what factors are affecting them—in near real-time. These dashboards act as a financial GPS, informing you when and where you need to tweak your business strategy.
Keep an eye on these constantly. For a more thorough analysis of organizational health, set up mid-year or even quarterly performance reviews. Are you still on target?
Use rolling forecasts to find out if you are. You may even modify your budget to more closely align with KPI targets.
Common mistakes in KPI tracking
As a finance leader, you're a guardian of the KPIs. It's your job to select KPIs that are relevant to overarching strategic goals and ensure the data backing them is solid.
However, when you're dealing with data, mistakes are inevitable. Here are some of the most common mistakes financial leaders make when tracking KPIs (and how you can avoid them):
1. Failing to focus on the KPIs most relevant to the business
Keeping track of KPIs isn't really useful on its own. You need to tie each KPI to a specific goal, and each one needs to direct action.
We've gone over a lot of KPIs above, but which are most relevant to you?
To find the answer, it's best to involve the executive leadership team in your KPI planning process. You'll also want to promote company-wide employee engagement—team members from different departments may have better insights into how to meet the KPI targets set.
2. Prioritizing short-term initiatives over long-term goals
While KPIs can sometimes direct attention to immediate results, such as boosting customer retention by slashing prices, they might inadvertently compromise long-term objectives, like maintaining a healthy gross profit margin.
It's essential to strike a balance: use short-term objectives as building blocks for your broader, long-term vision. Rapid customer acquisition is commendable, but not if the costs of marketing and ramped-up production are unsustainable.
Similarly, while it might be challenging to link research and development directly to a KPI, neglecting it risks ceding ground to competitors in the long run.
3. Relying on flawed data
You want to tie your strategy to KPIs—but what if your calculations of KPIs are flawed? You could record the cost of goods sold incorrectly, for example. While, yes, you could painstakingly record everything in spreadsheets, consider investing in software that records everything automatically. This not only saves time, but also prevents data entry errors so you can feel confident in the quality of the data you're working with.
4. Failing to analyze KPIs
Simply doing the calculations and getting the numbers isn't enough—KPI results need to be analyzed. This is where you think about their historical context, what external and internal variables are affecting them, and how they're projected to change in the future. All this assists in guiding your strategic planning and maintaining a healthy company.
5. Setting unrealistic targets
Establishing unrealistic goals can demoralize teams and erode motivation. To ensure that targets are grounded in reality, it's essential to incorporate benchmarking, comparing your objectives to industry standards or peer performance. Striking a balance between ambition and attainability is key. It's important to challenge your team without setting them up for inevitable failure.
6. Focusing only on quantitative KPIs
For those of us in finance, it's easy to get lost in the numbers. However, it's crucial not to overlook qualitative KPIs. Metrics such as customer satisfaction and employee engagement offer insights that raw numbers can't capture.
Qualitative KPIs tap into the intangible aspects of business—like customer loyalty, brand reputation, and team morale—which, in turn, can have profound impacts on quantitative outcomes. These indicators provide a comprehensive understanding of an organization's health, revealing potential challenges or opportunities that might not be immediately evident through numerical data alone.
Conclusion: stay one step ahead
In the world of finance, staying informed and proactive is paramount. By closely monitoring these 10 essential KPIs, you can safeguard your company's health today—and continuously improve it over time.
Want to learn how Cube can help you build (and boost) organizational health? Request a free demo today.